

Spontaneous calcium oscillations regulate human cardiac progenitor cell growth
- PMID: 19745162
- PMCID: PMC2777616
- DOI: 10.1161/CIRCRESAHA.109.206698
Spontaneous calcium oscillations regulate human cardiac progenitor cell growth
Abstract
Rationale: The adult heart possesses a pool of progenitor cells stored in myocardial niches, but the mechanisms involved in the activation of this cell compartment are currently unknown.
Objective: Ca2+ promotes cell growth raising the possibility that changes in intracellular Ca2+ initiate division of c-kit-positive human cardiac progenitor cells (hCPCs) and determine their fate.
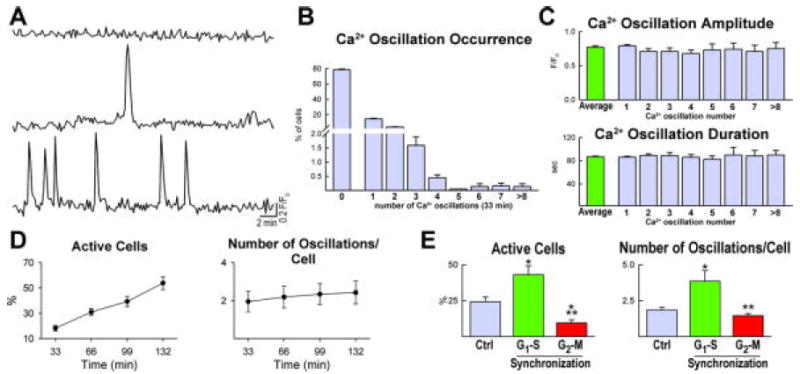
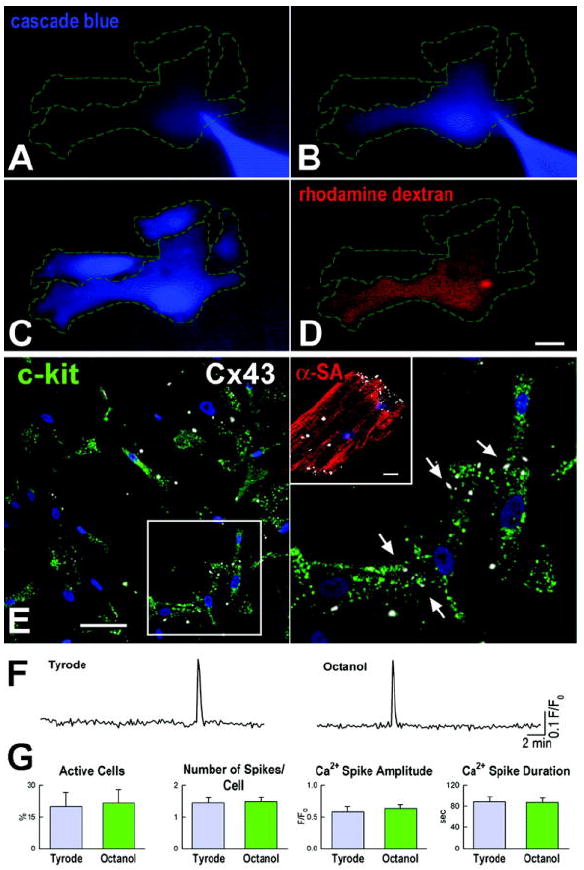
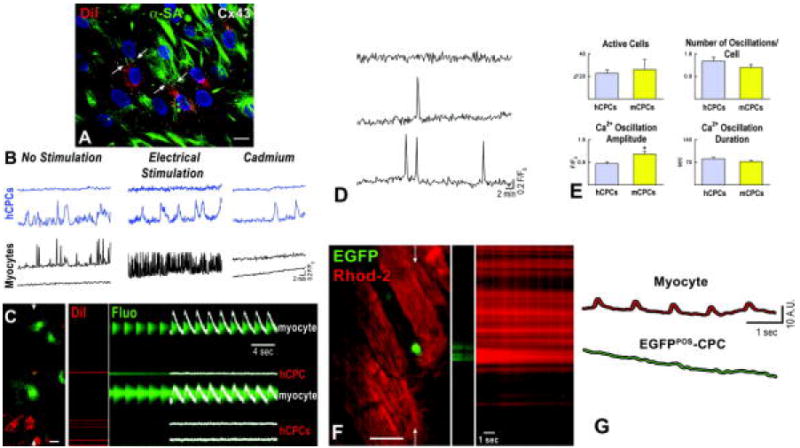
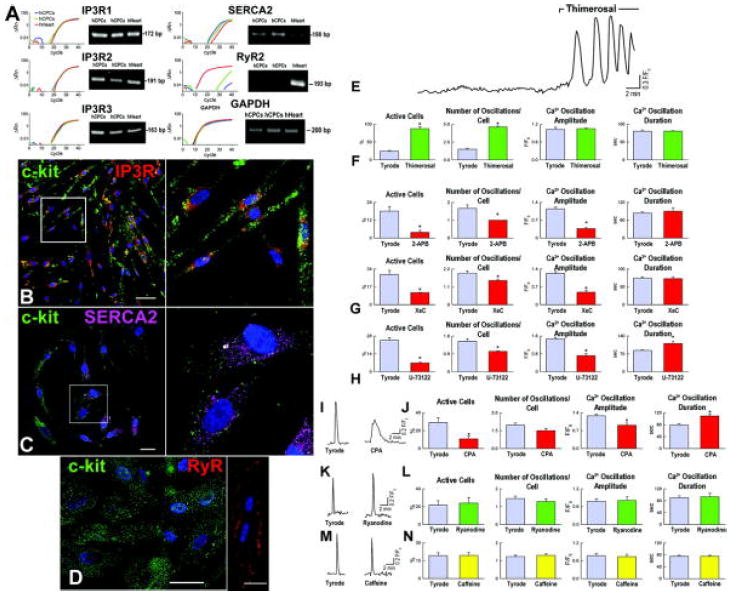
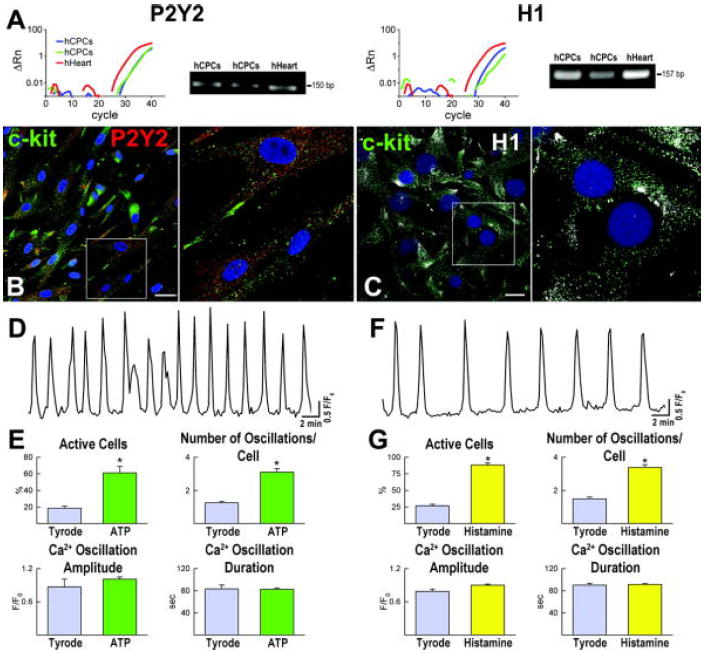
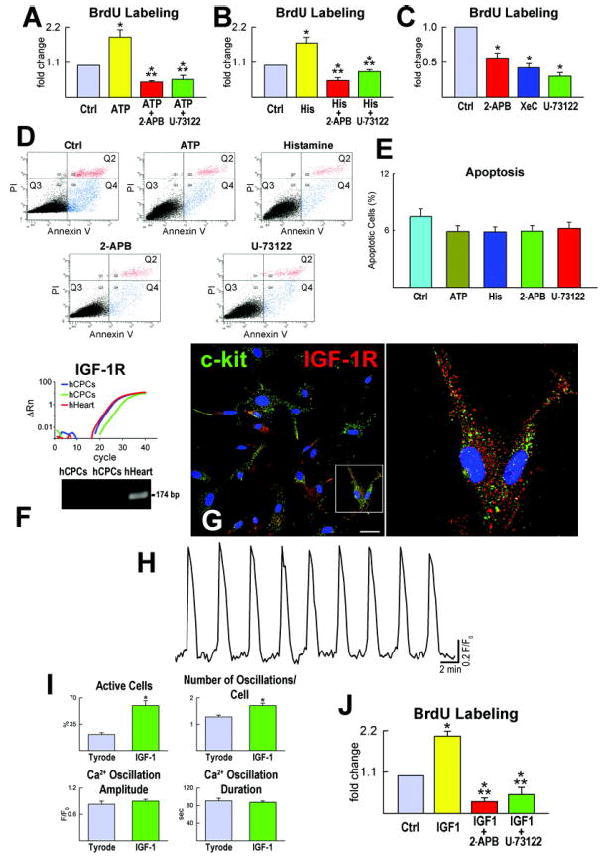
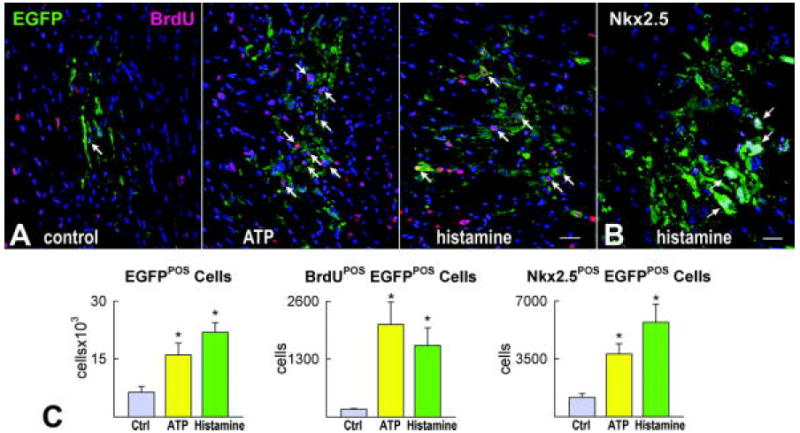
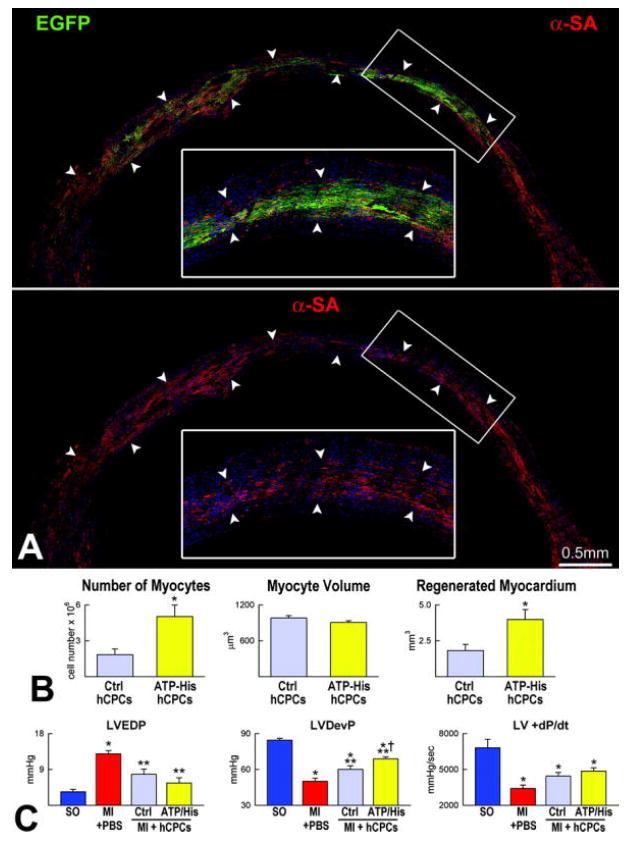
Methods and results: Ca2+ oscillations were identified in hCPCs and these events occurred independently from coupling with cardiomyocytes or the presence of extracellular Ca2+. These findings were confirmed in the heart of transgenic mice in which enhanced green fluorescent protein was under the control of the c-kit promoter. Ca2+ oscillations in hCPCs were regulated by the release of Ca2+ from the endoplasmic reticulum through activation of inositol 1,4,5-triphosphate receptors (IP3Rs) and the reuptake of Ca2+ by the sarco-/endoplasmic reticulum Ca2+ pump (SERCA). IP3Rs and SERCA were highly expressed in hCPCs, whereas ryanodine receptors were not detected. Although Na+-Ca2+ exchanger, store-operated Ca2+ channels and plasma membrane Ca2+ pump were present and functional in hCPCs, they had no direct effects on Ca2+ oscillations. Conversely, Ca2+ oscillations and their frequency markedly increased with ATP and histamine which activated purinoceptors and histamine-1 receptors highly expressed in hCPCs. Importantly, Ca2+ oscillations in hCPCs were coupled with the entry of cells into the cell cycle and 5-bromodeoxyuridine incorporation. Induction of Ca2+ oscillations in hCPCs before their intramyocardial delivery to infarcted hearts was associated with enhanced engraftment and expansion of these cells promoting the generation of a large myocyte progeny.
Conclusion: IP3R-mediated Ca2+ mobilization control hCPC growth and their regenerative potential.
Figures
Similar articles
-
Inositol-1,4,5-trisphosphate-mediated spontaneous activity in mouse embryonic stem cell-derived cardiomyocytes.J Physiol. 2007 Jun 15;581(Pt 3):1113-27. doi: 10.1113/jphysiol.2006.125955. Epub 2007 Mar 22. J Physiol. 2007. PMID: 17379641 Free PMC article.
-
Histamine-induced Ca2+ oscillations in a human endothelial cell line depend on transmembrane ion flux, ryanodine receptors and endoplasmic reticulum Ca2+-ATPase.J Physiol. 2000 May 1;524 Pt 3(Pt 3):701-13. doi: 10.1111/j.1469-7793.2000.00701.x. J Physiol. 2000. PMID: 10790152 Free PMC article.
-
Sarco-Endoplasmic Reticulum Calcium Release Model Based on Changes in the Luminal Calcium Content.Adv Exp Med Biol. 2020;1131:337-370. doi: 10.1007/978-3-030-12457-1_14. Adv Exp Med Biol. 2020. PMID: 31646517 Review.
-
P2Y2 Nucleotide Receptor Prompts Human Cardiac Progenitor Cell Activation by Modulating Hippo Signaling.Circ Res. 2017 Nov 10;121(11):1224-1236. doi: 10.1161/CIRCRESAHA.117.310812. Epub 2017 Sep 18. Circ Res. 2017. PMID: 28923792 Free PMC article.
-
Alterations of the Endoplasmic Reticulum (ER) Calcium Signaling Molecular Components in Alzheimer's Disease.Cells. 2020 Dec 1;9(12):2577. doi: 10.3390/cells9122577. Cells. 2020. PMID: 33271984 Free PMC article. Review.
Cited by
-
Forcing stem cells to behave: a biophysical perspective of the cellular microenvironment.Annu Rev Biophys. 2012;41:519-42. doi: 10.1146/annurev-biophys-042910-155306. Epub 2012 Feb 23. Annu Rev Biophys. 2012. PMID: 22404680 Free PMC article. Review.
-
Buffering and total calcium levels determine the presence of oscillatory regimes in cardiac cells.PLoS Comput Biol. 2020 Sep 24;16(9):e1007728. doi: 10.1371/journal.pcbi.1007728. eCollection 2020 Sep. PLoS Comput Biol. 2020. PMID: 32970668 Free PMC article.
-
Nuclear Calcium/Calmodulin-dependent Protein Kinase II Signaling Enhances Cardiac Progenitor Cell Survival and Cardiac Lineage Commitment.J Biol Chem. 2015 Oct 16;290(42):25411-26. doi: 10.1074/jbc.M115.657775. Epub 2015 Aug 31. J Biol Chem. 2015. PMID: 26324717 Free PMC article.
-
Effects of age and heart failure on human cardiac stem cell function.Am J Pathol. 2011 Jul;179(1):349-66. doi: 10.1016/j.ajpath.2011.03.036. Epub 2011 May 19. Am J Pathol. 2011. PMID: 21703415 Free PMC article.
-
Functional ion channels in stem cells.World J Stem Cells. 2011 Mar 26;3(3):19-24. doi: 10.4252/wjsc.v3.i3.19. World J Stem Cells. 2011. PMID: 21607133 Free PMC article.
References
-
- Anversa P, Kajstura J, Leri A, Bolli R. Life and death of cardiac stem cells: a paradigm shift in cardiac biology. Circulation. 2006;113:1451–1463. - PubMed
-
- Smith RR, Barile L, Cho HC, Leppo MK, Hare JM, Messina E, Giacomello A, Abraham MR, Marban E. Regenerative potential of cardiosphere-derived cells expanded from percutaneous endomyocardial biopsy specimens. Circulation. 2007;115:896–908. - PubMed
-
- Bearzi C, Rota M, Hosoda T, Tillmanns J, Nascimbene A, De Angelis A, Yasuzawa-Amano S, Trofimova I, Siggins RW, Lecapitaine N, Cascapera S, Beltrami AP, D’Alessandro DA, Zias E, Quaini F, Urbanek K, Michler RE, Bolli R, Kajstura J, Leri A, Anversa P. Human cardiac stem cells. Proc Natl Acad Sci USA. 2007;104:14068–14073. - PMC - PubMed
-
- Lakatta EG, Levy D. Arterial and cardiac aging: major shareholders in cardiovascular disease enterprises: Part II: the aging heart in health: links to heart disease. Circulation. 2003;107:346–354. - PubMed
-
- Torella D, Rota M, Nurzynska D, Musso E, Monsen A, Shiraishi I, Zias E, Walsh K, Rosenzweig A, Sussman MA, Urbanek K, Nadal-Ginard B, Kajstura J, Anversa P, Leri A. Cardiac stem cell and myocyte aging, heart failure, and insulin-like growth factor-1 overexpression. Circ Res. 2004;94:514–524. - PubMed
Publication types
MeSH terms
Substances
Grants and funding
- R01 HL075480-05/HL/NHLBI NIH HHS/United States
- R01 AG017042/AG/NIA NIH HHS/United States
- R01 HL065577-07/HL/NHLBI NIH HHS/United States
- R01 HL091021-01A2S1/HL/NHLBI NIH HHS/United States
- R01 HL075480/HL/NHLBI NIH HHS/United States
- R21 HL094894-01S1/HL/NHLBI NIH HHS/United States
- P01 HL092868/HL/NHLBI NIH HHS/United States
- R01 HL065573-07/HL/NHLBI NIH HHS/United States
- R37 HL081737-05/HL/NHLBI NIH HHS/United States
- R01 HL039902/HL/NHLBI NIH HHS/United States
- R01 HL039902-18/HL/NHLBI NIH HHS/United States
- R01 AG026107/AG/NIA NIH HHS/United States
- R37 HL081737/HL/NHLBI NIH HHS/United States
- R01 HL091021-01A2/HL/NHLBI NIH HHS/United States
- R01 HL111183/HL/NHLBI NIH HHS/United States
- R21 HL094894-01/HL/NHLBI NIH HHS/United States
- R01 AG017042-09/AG/NIA NIH HHS/United States
- R01 HL091021/HL/NHLBI NIH HHS/United States
- R01 AG026107-04/AG/NIA NIH HHS/United States
- P01 HL092868-02/HL/NHLBI NIH HHS/United States
- R01 HL065577/HL/NHLBI NIH HHS/United States
- R21 HL094894/HL/NHLBI NIH HHS/United States
- R01 HL065573/HL/NHLBI NIH HHS/United States
LinkOut - more resources
Full Text Sources
Medical
Molecular Biology Databases
Miscellaneous
