Unbiased reconstruction of a mammalian transcriptional network mediating pathogen responses
- PMID: 19729616
- PMCID: PMC2879337
- DOI: 10.1126/science.1179050
Unbiased reconstruction of a mammalian transcriptional network mediating pathogen responses
Abstract
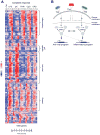
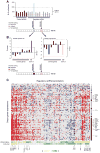
Models of mammalian regulatory networks controlling gene expression have been inferred from genomic data but have largely not been validated. We present an unbiased strategy to systematically perturb candidate regulators and monitor cellular transcriptional responses. We applied this approach to derive regulatory networks that control the transcriptional response of mouse primary dendritic cells to pathogens. Our approach revealed the regulatory functions of 125 transcription factors, chromatin modifiers, and RNA binding proteins, which enabled the construction of a network model consisting of 24 core regulators and 76 fine-tuners that help to explain how pathogen-sensing pathways achieve specificity. This study establishes a broadly applicable, comprehensive, and unbiased approach to reveal the wiring and functions of a regulatory network controlling a major transcriptional response in primary mammalian cells.
Figures


Similar articles
-
Transcriptional networks in plasmacytoid dendritic cells stimulated with synthetic TLR 7 agonists.BMC Immunol. 2007 Oct 12;8:26. doi: 10.1186/1471-2172-8-26. BMC Immunol. 2007. PMID: 17935622 Free PMC article.
-
Reconstruction of gene regulatory networks reveals chromatin remodelers and key transcription factors in tumorigenesis.Genome Med. 2016 May 19;8(1):57. doi: 10.1186/s13073-016-0310-3. Genome Med. 2016. PMID: 27198694 Free PMC article.
-
Sumoylation coordinates the repression of inflammatory and anti-viral gene-expression programs during innate sensing.Nat Immunol. 2016 Feb;17(2):140-9. doi: 10.1038/ni.3342. Epub 2015 Dec 14. Nat Immunol. 2016. PMID: 26657003
-
Transcriptional Networks Driving Dendritic Cell Differentiation and Function.Immunity. 2020 Jun 16;52(6):942-956. doi: 10.1016/j.immuni.2020.05.005. Immunity. 2020. PMID: 32553180 Review.
-
Transcriptional programming of the dendritic cell network.Nat Rev Immunol. 2012 Jan 25;12(2):101-13. doi: 10.1038/nri3149. Nat Rev Immunol. 2012. PMID: 22273772 Review.
Cited by
-
Identification of TIMP1-induced dysregulation of epithelial-mesenchymal transition as a key pathway in inflammatory bowel disease and small intestinal neuroendocrine tumors shared pathogenesis.Front Genet. 2024 Aug 21;15:1376123. doi: 10.3389/fgene.2024.1376123. eCollection 2024. Front Genet. 2024. PMID: 39233736 Free PMC article.
-
Transcription Factor Activity Regulating Macrophage Heterogeneity during Skin Wound Healing.J Immunol. 2024 Aug 15;213(4):506-518. doi: 10.4049/jimmunol.2400172. J Immunol. 2024. PMID: 38940624
-
Dynamical and combinatorial coding by MAPK p38 and NFκB in the inflammatory response of macrophages.Mol Syst Biol. 2024 Aug;20(8):898-932. doi: 10.1038/s44320-024-00047-4. Epub 2024 Jun 13. Mol Syst Biol. 2024. PMID: 38872050 Free PMC article.
-
Diagnostic value of cytokines in severe childhood Mycoplasma pneumoniae pneumonia combined with Adenovirus infection.Ital J Pediatr. 2024 May 7;50(1):92. doi: 10.1186/s13052-024-01661-6. Ital J Pediatr. 2024. PMID: 38715105 Free PMC article.
-
scCRT: a contrastive-based dimensionality reduction model for scRNA-seq trajectory inference.Brief Bioinform. 2024 Mar 27;25(3):bbae204. doi: 10.1093/bib/bbae204. Brief Bioinform. 2024. PMID: 38701412 Free PMC article.
References
-
- Huang Q, et al. Science. 2001 Oct 26;294:870. - PubMed
Publication types
MeSH terms
Substances
Associated data
- Actions
Grants and funding
LinkOut - more resources
Full Text Sources
Other Literature Sources

