

Role of the macrophage inflammatory protein-1alpha/CC chemokine receptor 5 signaling pathway in the neuroinflammatory response and cognitive deficits induced by beta-amyloid peptide
- PMID: 19729478
- PMCID: PMC2751555
- DOI: 10.2353/ajpath.2009.081113
Role of the macrophage inflammatory protein-1alpha/CC chemokine receptor 5 signaling pathway in the neuroinflammatory response and cognitive deficits induced by beta-amyloid peptide
Abstract
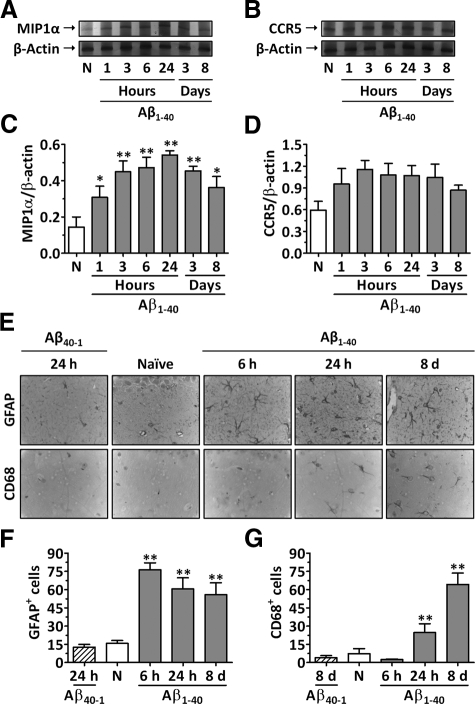
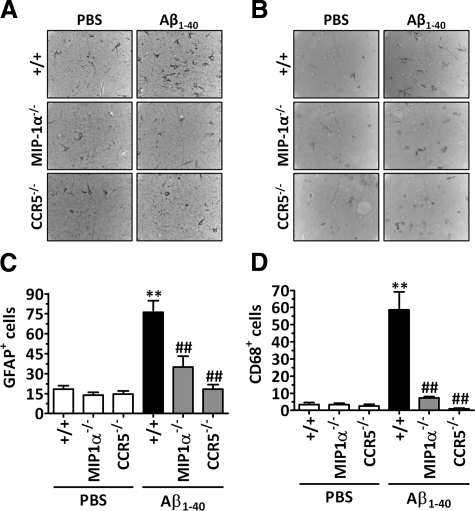
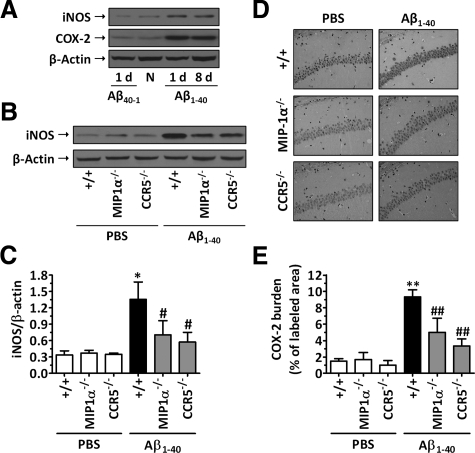
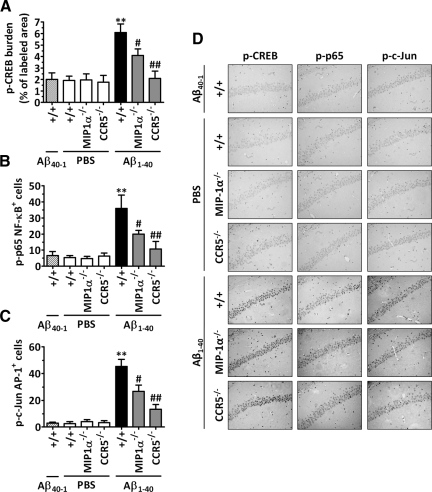
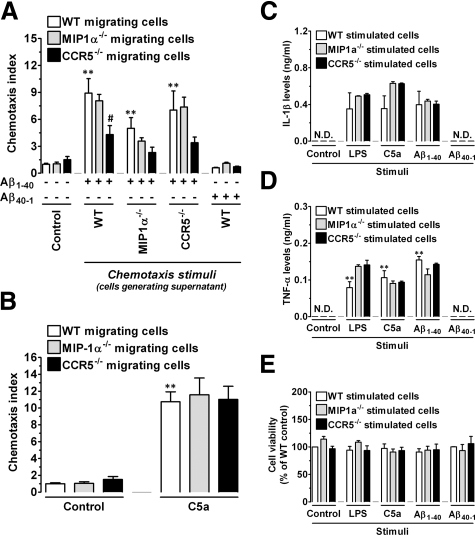
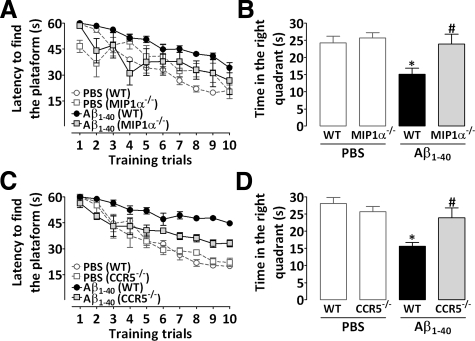
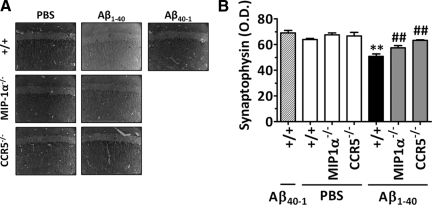
The hallmarks of Alzheimer's disease include the deposition of beta-amyloid (Abeta), neuroinflammation, and cognitive deficits. The accumulation of activated glial cells in cognitive-related areas is critical for these alterations, although little is known about the mechanisms driving this event. Herein we used macrophage inflammatory protein-1alpha (MIP-1alpha(-/-))- or CC-chemokine receptor 5 (CCR5(-/-))-deficient mice to address the role played by chemokines in molecular and behavioral alterations induced by Abeta(1-40). Abeta(1-40) induced a time-dependent increase of MIP-1alpha mRNA followed by accumulation of activated glial cells in the hippocampus of wild-type mice. MIP-1alpha(-/-) and CCR5(-/-) mice displayed reduced astrocytosis and microgliosis in the hippocampus after Abeta(1-40) administration that was associated with decreased expression of cyclooxygenase-2 and inducible nitric oxide synthase, as well as reduced activation of nuclear factor-kappaB, activator protein-1 and cyclic AMP response element-binding protein. Furthermore, MIP-1alpha(-/-) and CCR5(-/-) macrophages showed impaired chemotaxis in vitro, although cytokine production in response to Abeta(1-40) was unaffected. Notably, the cognitive deficits and synaptic dysfunction induced by Abeta(1-40) were also attenuated in MIP-1alpha(-/-) and CCR5(-/-) mice. Collectively, these results indicate that the MIP-1alpha/CCR5 signaling pathway is critical for the accumulation of activated glial cells in the hippocampus and, therefore, for the inflammation and cognitive failure induced by Abeta(1-40). Our data suggest MIP-1alpha and CCR5 as potential therapeutic targets for Alzheimer's disease treatment.
Figures
Similar articles
-
B₂ receptor blockage prevents Aβ-induced cognitive impairment by neuroinflammation inhibition.Behav Brain Res. 2015 Feb 1;278:482-91. doi: 10.1016/j.bbr.2014.10.040. Epub 2014 Nov 3. Behav Brain Res. 2015. PMID: 25446751
-
Characterization of the expression of macrophage inflammatory protein-1α (MIP-1α) and C-C chemokine receptor 5 (CCR5) after kainic acid-induced status epilepticus (SE) in juvenile rats.Neuropathol Appl Neurobiol. 2012 Oct;38(6):602-16. doi: 10.1111/j.1365-2990.2012.01251.x. Neuropathol Appl Neurobiol. 2012. PMID: 22248156
-
Peripheral T cells overexpress MIP-1alpha to enhance its transendothelial migration in Alzheimer's disease.Neurobiol Aging. 2007 Apr;28(4):485-96. doi: 10.1016/j.neurobiolaging.2006.02.013. Epub 2006 Apr 5. Neurobiol Aging. 2007. PMID: 16600437
-
Relationship between the chemokine receptor CCR5 and microglia in neurological disorders: consequences of targeting CCR5 on neuroinflammation, neuronal death and regeneration in a model of epilepsy.CNS Neurol Disord Drug Targets. 2013 Sep;12(6):815-29. doi: 10.2174/18715273113126660173. CNS Neurol Disord Drug Targets. 2013. PMID: 24047524 Review.
-
Macrophage inflammatory protein-1.Cytokine Growth Factor Rev. 2002 Dec;13(6):455-81. doi: 10.1016/s1359-6101(02)00045-x. Cytokine Growth Factor Rev. 2002. PMID: 12401480 Review.
Cited by
-
The bradykinin B1 receptor regulates Aβ deposition and neuroinflammation in Tg-SwDI mice.Am J Pathol. 2013 May;182(5):1740-9. doi: 10.1016/j.ajpath.2013.01.021. Epub 2013 Mar 5. Am J Pathol. 2013. PMID: 23470163 Free PMC article.
-
The P2X7 Receptor, a Multifaceted Receptor in Alzheimer's Disease.Int J Mol Sci. 2023 Jul 21;24(14):11747. doi: 10.3390/ijms241411747. Int J Mol Sci. 2023. PMID: 37511507 Free PMC article. Review.
-
The intricate role of CCL5/CCR5 axis in Alzheimer disease.J Neuropathol Exp Neurol. 2023 Oct 20;82(11):894-900. doi: 10.1093/jnen/nlad071. J Neuropathol Exp Neurol. 2023. PMID: 37769321 Free PMC article. Review.
-
Role of Neuron and Glia in Alzheimer's Disease and Associated Vascular Dysfunction.Front Aging Neurosci. 2021 Jun 15;13:653334. doi: 10.3389/fnagi.2021.653334. eCollection 2021. Front Aging Neurosci. 2021. PMID: 34211387 Free PMC article.
-
Roles of Microglial and Monocyte Chemokines and Their Receptors in Regulating Alzheimer's Disease-Associated Amyloid-β and Tau Pathologies.Front Neurol. 2018 Aug 14;9:549. doi: 10.3389/fneur.2018.00549. eCollection 2018. Front Neurol. 2018. PMID: 30158892 Free PMC article. Review.
References
-
- Walsh DM, Selkoe DJ. Deciphering the molecular basis of memory failure in Alzheimer’s disease. Neuron. 2004;44:181–193. - PubMed
-
- González-Scarano F, Baltuch G. Microglia as mediators of inflammatory and degenerative diseases. Annu Rev Neurosci. 1999;22:219–240. - PubMed
-
- Luster AD. Chemokines—chemotactic cytokines that mediate inflammation. N Engl J Med. 1998;338:436–445. - PubMed
-
- Charo IF, Ransohoff RM. The many roles of chemokines and chemokine receptors in inflammation. N Engl J Med. 2006;354:610–621. - PubMed
-
- Cartier L, Hartley O, Dubois-Dauphin M, Krause KH. Chemokine receptors in the central nervous system: role in brain inflammation and neurodegenerative diseases. Brain Res Brain Res Rev. 2005;48:16–42. - PubMed
Publication types
MeSH terms
Substances
LinkOut - more resources
Full Text Sources
Molecular Biology Databases
Research Materials
