

Generation of mature human myelomonocytic cells through expansion and differentiation of pluripotent stem cell-derived lin-CD34+CD43+CD45+ progenitors
- PMID: 19726877
- PMCID: PMC2735935
- DOI: 10.1172/JCI38591
Generation of mature human myelomonocytic cells through expansion and differentiation of pluripotent stem cell-derived lin-CD34+CD43+CD45+ progenitors
Abstract
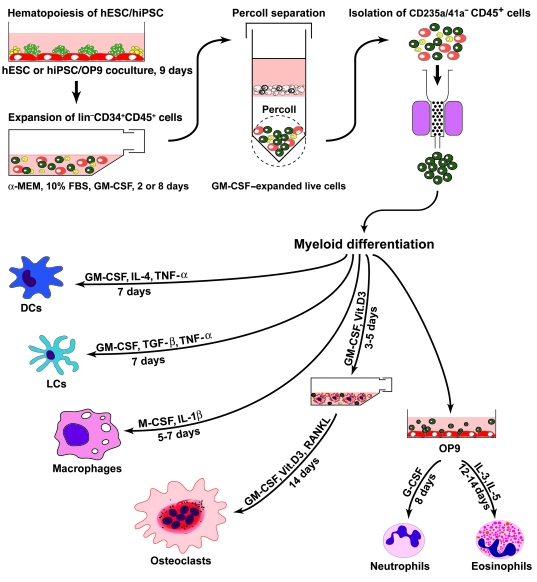
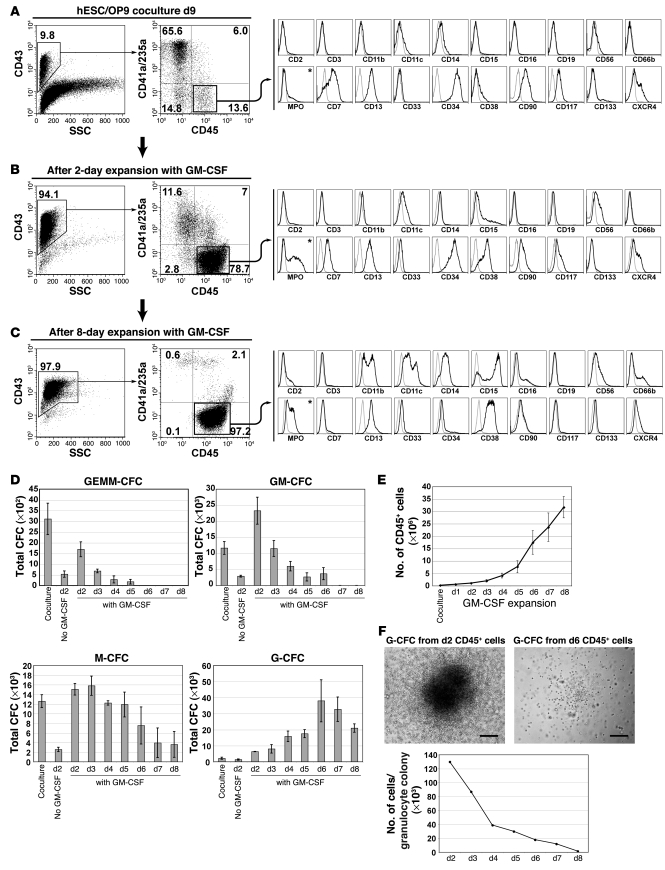
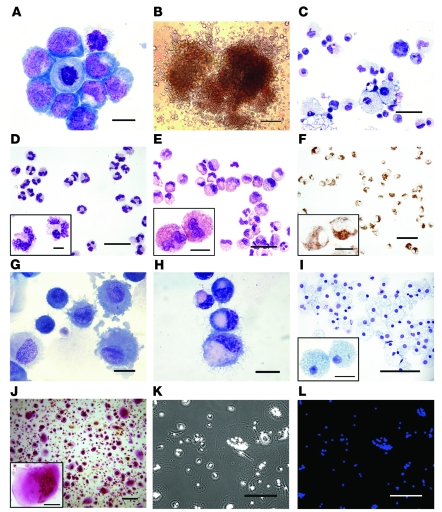
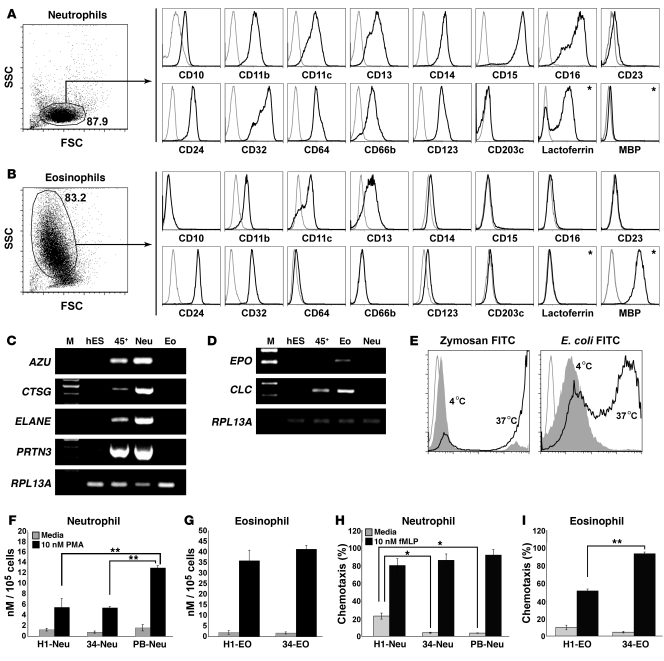
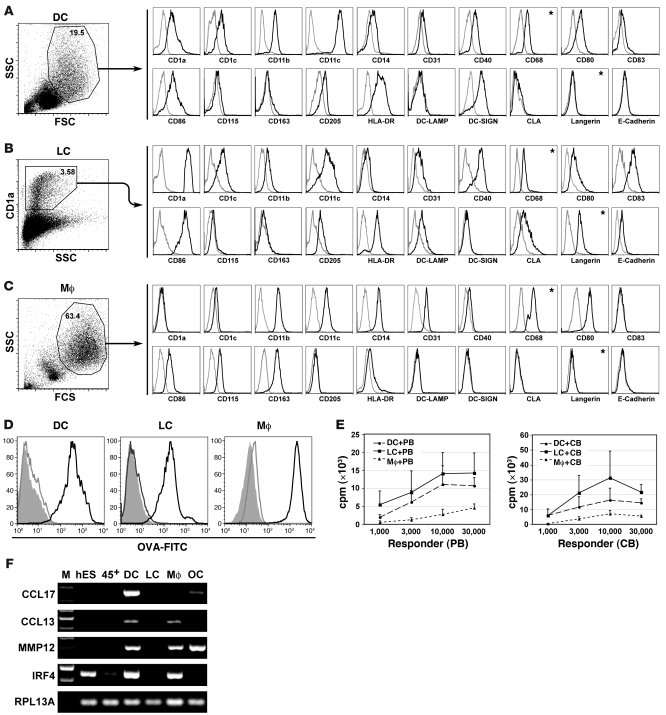
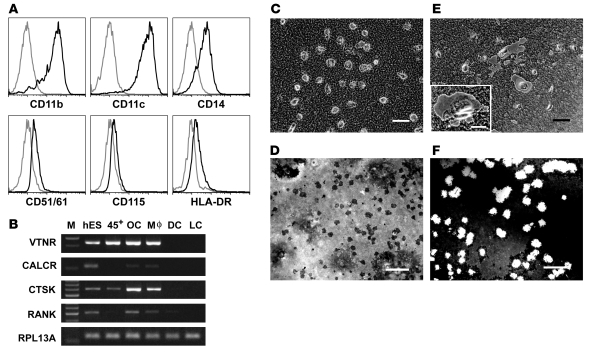
Basic research into human mature myelomonocytic cell function, myeloid lineage diversification and leukemic transformation, and assessment of myelotoxicity in preclinical drug development requires a constant supply of donor blood or bone marrow samples and laborious purification of mature myeloid cells or progenitors, which are present in very small quantities. To overcome these limitations, we have developed a protocol for efficient generation of neutrophils, eosinophils, macrophages, osteoclasts, DCs, and Langerhans cells from human embryonic stem cells (hESCs). As a first step, we generated lin-CD34+CD43+CD45+ hematopoietic cells highly enriched in myeloid progenitors through coculture of hESCs with OP9 feeder cells. After expansion in the presence of GM-CSF, these cells were directly differentiated with specific cytokine combinations toward mature cells of particular types. Morphologic, phenotypic, molecular, and functional analyses revealed that hESC-derived myelomonocytic cells were comparable to their corresponding somatic counterparts. In addition, we demonstrated that a similar protocol could be used to generate myelomonocytic cells from induced pluripotent stem cells (iPSCs). This technology offers an opportunity to generate large numbers of patient-specific myelomonocytic cells for in vitro studies of human disease mechanisms as well as for drug screening.
Figures
Similar articles
-
Hematopoietic and endothelial differentiation of human induced pluripotent stem cells.Stem Cells. 2009 Mar;27(3):559-67. doi: 10.1634/stemcells.2008-0922. Stem Cells. 2009. PMID: 19259936 Free PMC article.
-
Leukosialin (CD43) defines hematopoietic progenitors in human embryonic stem cell differentiation cultures.Blood. 2006 Sep 15;108(6):2095-105. doi: 10.1182/blood-2006-02-003327. Epub 2006 Jun 6. Blood. 2006. PMID: 16757688 Free PMC article.
-
Hematopoietic differentiation and production of mature myeloid cells from human pluripotent stem cells.Nat Protoc. 2011 Mar;6(3):296-313. doi: 10.1038/nprot.2010.184. Epub 2011 Feb 17. Nat Protoc. 2011. PMID: 21372811 Free PMC article.
-
Human pluripotent stem cells differentiated in fully defined medium generate hematopoietic CD34- and CD34+ progenitors with distinct characteristics.PLoS One. 2011 Feb 25;6(2):e14733. doi: 10.1371/journal.pone.0014733. PLoS One. 2011. PMID: 21364915 Free PMC article.
-
Hematopoietic differentiation.2012 Jun 10. In: StemBook [Internet]. Cambridge (MA): Harvard Stem Cell Institute; 2008–. 2012 Jun 10. In: StemBook [Internet]. Cambridge (MA): Harvard Stem Cell Institute; 2008–. PMID: 23658971 Free Books & Documents. Review.
Cited by
-
Bone Cells Differentiation: How CFTR Mutations May Rule the Game of Stem Cells Commitment?Front Cell Dev Biol. 2021 May 7;9:611921. doi: 10.3389/fcell.2021.611921. eCollection 2021. Front Cell Dev Biol. 2021. PMID: 34026749 Free PMC article. Review.
-
Exploring the promising potential of induced pluripotent stem cells in cancer research and therapy.Mol Cancer. 2023 Nov 28;22(1):189. doi: 10.1186/s12943-023-01873-0. Mol Cancer. 2023. PMID: 38017433 Free PMC article. Review.
-
Generation of mature hematopoietic cells from human pluripotent stem cells.Int J Hematol. 2012 Jun;95(6):617-23. doi: 10.1007/s12185-012-1094-x. Epub 2012 May 31. Int J Hematol. 2012. PMID: 22648826 Review.
-
Regulatory Dendritic Cells, T Cell Tolerance, and Dendritic Cell Therapy for Immunologic Disease.Front Immunol. 2021 Mar 10;12:633436. doi: 10.3389/fimmu.2021.633436. eCollection 2021. Front Immunol. 2021. PMID: 33777019 Free PMC article. Review.
-
The Use of Patient-Specific Induced Pluripotent Stem Cells (iPSCs) to Identify Osteoclast Defects in Rare Genetic Bone Disorders.J Clin Med. 2014 Dec 17;3(4):1490-510. doi: 10.3390/jcm3041490. J Clin Med. 2014. PMID: 25621177 Free PMC article.
References
-
- Rado T.A., Wei X.P., Benz E.J., Jr. Isolation of lactoferrin cDNA from a human myeloid library and expression of mRNA during normal and leukemic myelopoiesis. Blood. . 1987;70:989–993. - PubMed
-
- Khanna-Gupta A., Kolibaba K., Zibello T.A., Berliner N. NB4 cells show bilineage potential and an aberrant pattern of neutrophil secondary granule protein gene expression. Blood. . 1994;84:294–302. - PubMed
Publication types
MeSH terms
Substances
Grants and funding
LinkOut - more resources
Full Text Sources
Other Literature Sources
Research Materials
Miscellaneous
