Identification of candidate epigenetic biomarkers for ovarian cancer detection
- PMID: 19724865
- PMCID: PMC2829240
Identification of candidate epigenetic biomarkers for ovarian cancer detection
Abstract
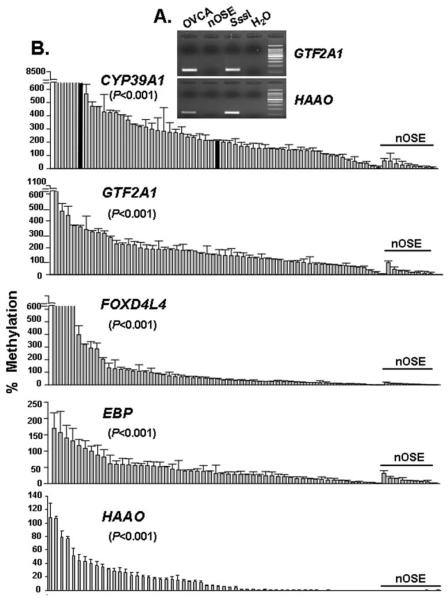
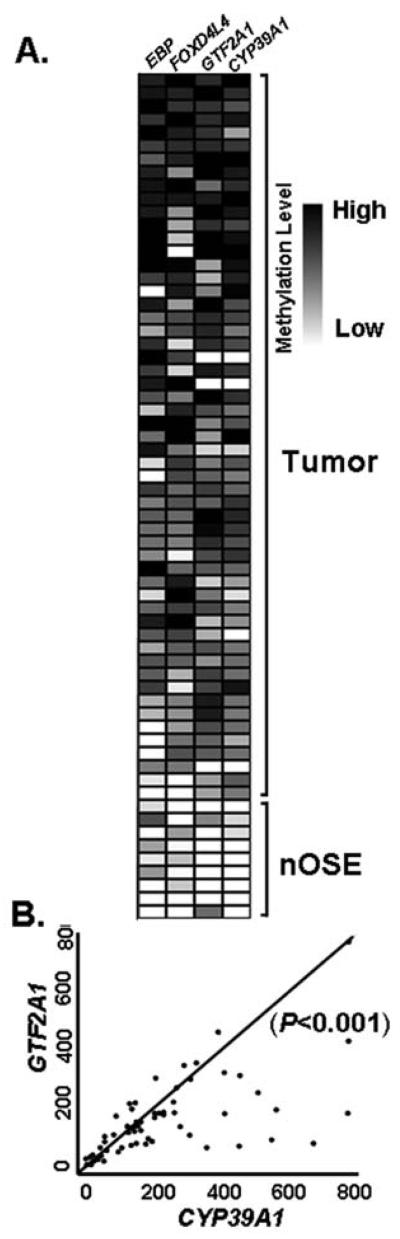
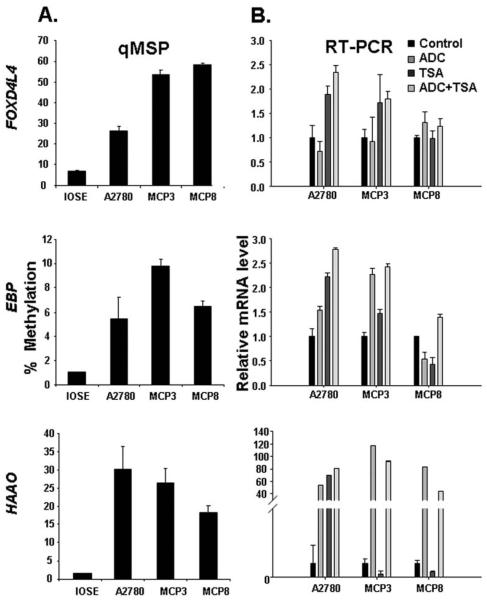
Ovarian cancer ranks the most lethal among gynecologic neoplasms in women. To develop potential biomarkers for diagnosis, we have identified five novel genes (CYP39A1, GTF2A1, FOXD4L4, EBP, and HAAO) that are hypermethylated in ovarian tumors, compared with the non-malignant normal ovarian surface epithelia, using the quantitative methylation-specific polymerase chain reactions. Interestingly enough, multivariate Cox regression analysis has identified hypermethylation of CYP39A1 correlated with an increase rate of relapsing (P=0.032, hazard ratio >1). Concordant hypermethylation in at least three loci was observed in 50 out of 55 (91%) of ovarian tumors examined. The test sensitivity and specificity were assessed to be 96 and 67% for CYP39A1; 95 and 88% for GTF2A1; 93 and 67% for FOXD4L4; 81 and 67% for EBP; 89 and 82% for HAAO, respectively. Our data have identified, for the first time, GTF2A1 alone, or GTF2A1 plus HAAO are excellent candidate biomarkers for detecting this disease. Moreover, the known functions of these gene products further implicate dysregulated transcriptional control, cholesterol metabolism, or synthesis of quinolinic acids, may play important roles in attributing to ovarian neoplasm. Molecular therapies, by reversing the aberrant epigenomes using inhibitory agents or by abrogating the upstream signaling pathways that convey the epigenomic perturbations, may be developed into promising treatment regimens.
Figures
Similar articles
-
Detection of aberrant methylation of HOXA9 and HIC1 through multiplex MethyLight assay in serum DNA for the early detection of epithelial ovarian cancer.Int J Cancer. 2020 Sep 15;147(6):1740-1752. doi: 10.1002/ijc.32984. Epub 2020 Mar 31. Int J Cancer. 2020. PMID: 32191343
-
Ovarian cancer detection by DNA methylation in cervical scrapings.Clin Epigenetics. 2019 Nov 27;11(1):166. doi: 10.1186/s13148-019-0773-3. Clin Epigenetics. 2019. PMID: 31775891 Free PMC article.
-
Diagnostic Value of a Group of MicroRNA Genes Hypermethylated in Ovarian Carcinoma.Bull Exp Biol Med. 2018 Dec;166(2):253-256. doi: 10.1007/s10517-018-4326-0. Epub 2018 Nov 28. Bull Exp Biol Med. 2018. PMID: 30488208
-
Epigenetic biomarkers in epithelial ovarian cancer.Cancer Lett. 2014 Jan 28;342(2):257-63. doi: 10.1016/j.canlet.2011.12.036. Epub 2012 Jan 12. Cancer Lett. 2014. PMID: 22245949 Review.
-
Hypermethylation of tumor suppressor genes is a risk factor for poor prognosis in ovarian cancer: A meta-analysis.Medicine (Baltimore). 2019 Feb;98(8):e14588. doi: 10.1097/MD.0000000000014588. Medicine (Baltimore). 2019. PMID: 30813180 Free PMC article. Review.
Cited by
-
Proteome mapping of epidermal growth factor induced hepatocellular carcinomas identifies novel cell metabolism targets and mitogen activated protein kinase signalling events.BMC Genomics. 2015 Feb 25;16(1):124. doi: 10.1186/s12864-015-1312-z. BMC Genomics. 2015. PMID: 25872475 Free PMC article.
-
Promoter methylation of H-cadherin is a potential biomarker in patients with bladder transitional cell carcinoma.Int Urol Nephrol. 2012 Feb;44(1):111-7. doi: 10.1007/s11255-011-9961-6. Epub 2011 Apr 24. Int Urol Nephrol. 2012. PMID: 21516472
-
Detection of endometrial cancer via molecular analysis of DNA collected with vaginal tampons.Gynecol Oncol. 2015 Apr;137(1):14-22. doi: 10.1016/j.ygyno.2015.01.552. Epub 2015 Feb 10. Gynecol Oncol. 2015. PMID: 25677060 Free PMC article.
-
Downregulation of CYP39A1 Serves as a Novel Biomarker in Hepatocellular Carcinoma with Worse Clinical Outcome.Oxid Med Cell Longev. 2021 Dec 31;2021:5175581. doi: 10.1155/2021/5175581. eCollection 2021. Oxid Med Cell Longev. 2021. PMID: 35003516 Free PMC article.
-
Predictive and prognostic molecular markers for cancer medicine.Ther Adv Med Oncol. 2010 Mar;2(2):125-48. doi: 10.1177/1758834009360519. Ther Adv Med Oncol. 2010. PMID: 21789130 Free PMC article.
References
-
- Jemal A, Siegel R, Ward E, Murray T, Xu J, Thun MJ. Cancer statistics, 2007. CA Cancer J Clin. 2007;57:43–66. - PubMed
-
- Bast RC, Jr, Badgwell D, Lu Z, Marquez R, Rosen D, Liu J, Baggerly KA, Atkinson EN, Skates S, Zhang Z, Lokshin A, Menon U, Jacobs I, Lu K. New tumor markers: CA125 and beyond. Int J Gynecol Cancer. 2005;15(Suppl 3):274–281. - PubMed
-
- Urban N, McIntosh MW, Andersen M, Karlan BY. Ovarian cancer screening. Hematol Oncol Clin North Am. 2003;17:989–1005. ix. - PubMed
-
- Jones PA, Baylin SB. The fundamental role of epigenetic events in cancer. Nat Rev Genet. 2002;3:415–428. - PubMed
-
- Feinberg AP, Tycko B. The history of cancer epigenetics. Nat Rev Cancer. 2004;4:143–153. - PubMed
Publication types
MeSH terms
Substances
Grants and funding
LinkOut - more resources
Full Text Sources
Other Literature Sources
Medical
Miscellaneous