. 2009 Nov 5;28(44):3866-79.
doi: 10.1038/onc.2009.257. Epub 2009 Aug 31.

Bone morphogenic protein 6: a member of a novel class of prognostic factors expressed by normal and malignant plasma cells inhibiting proliferation and angiogenesis

Affiliations

Bone morphogenic protein 6: a member of a novel class of prognostic factors expressed by normal and malignant plasma cells inhibiting proliferation and angiogenesis

A Seckinger et al. Oncogene. .

Abstract

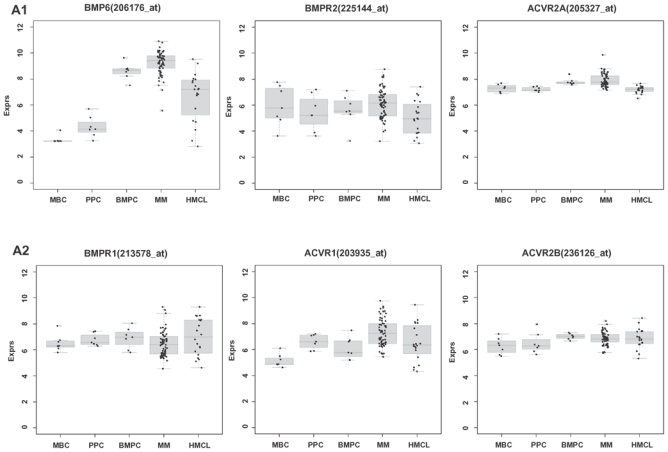
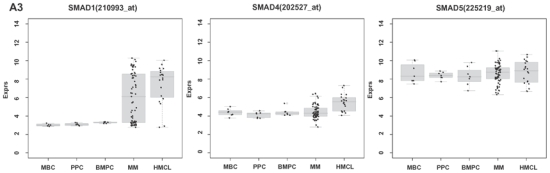
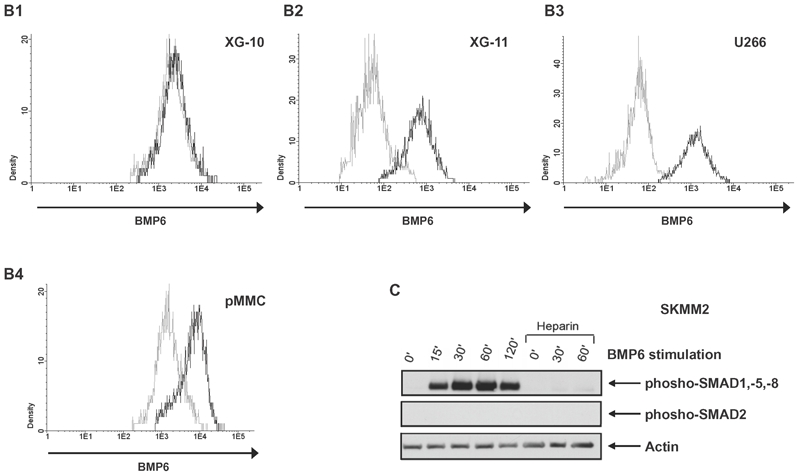
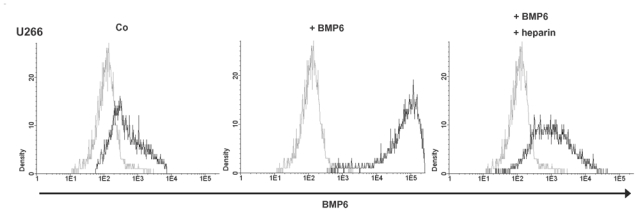
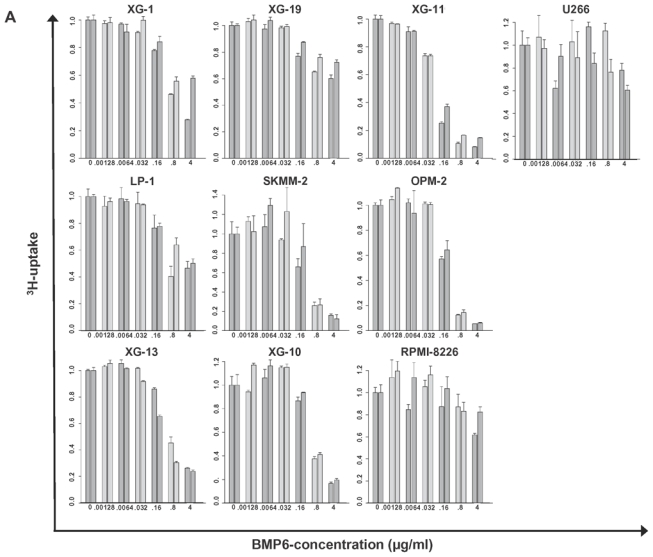
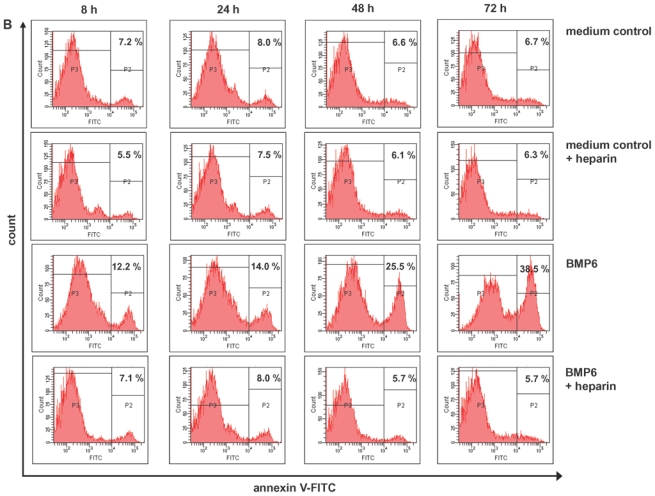
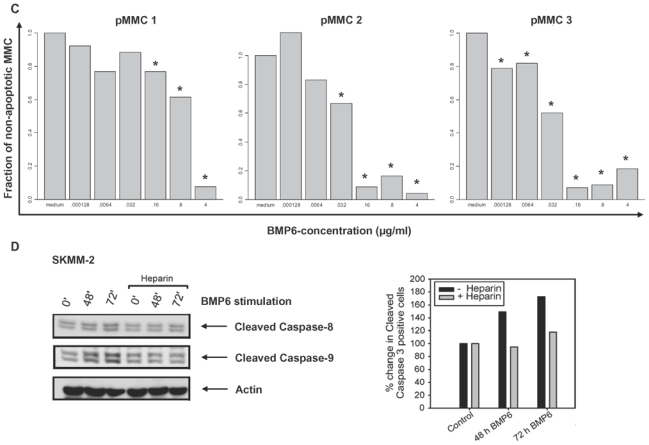
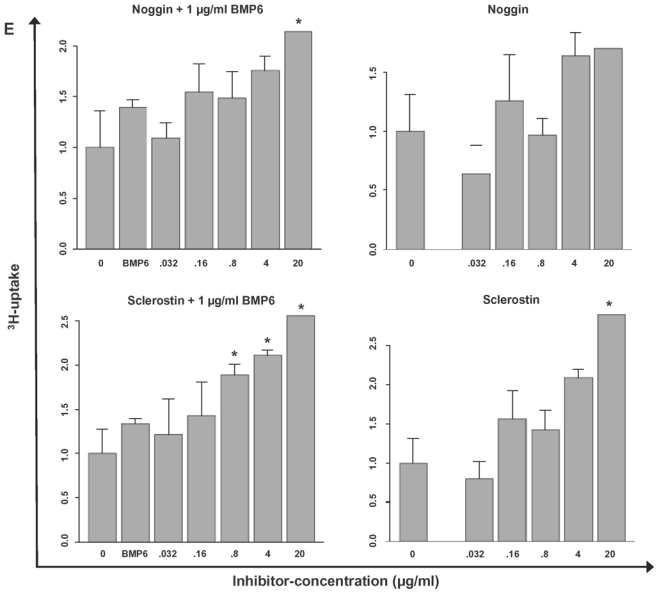
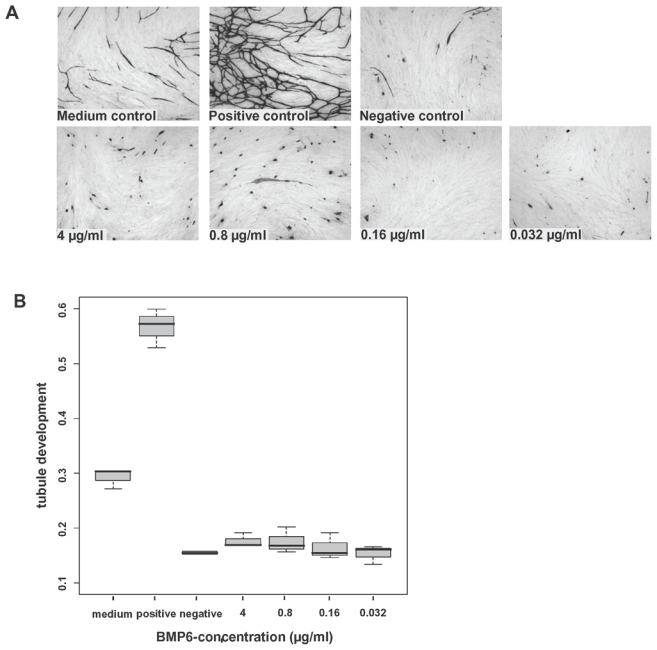
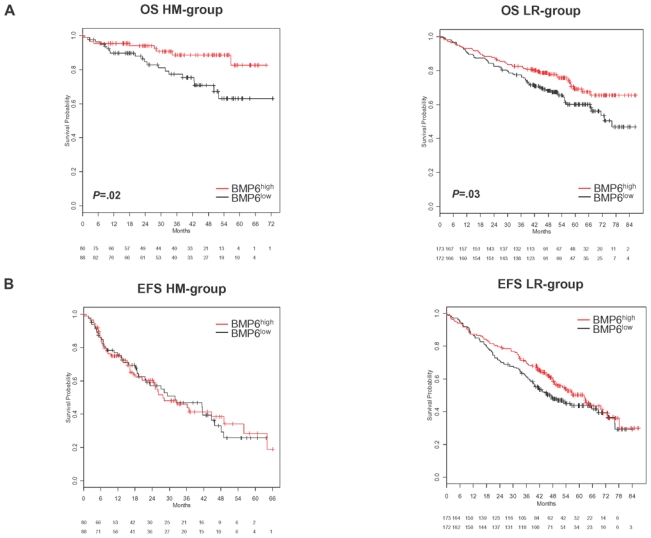
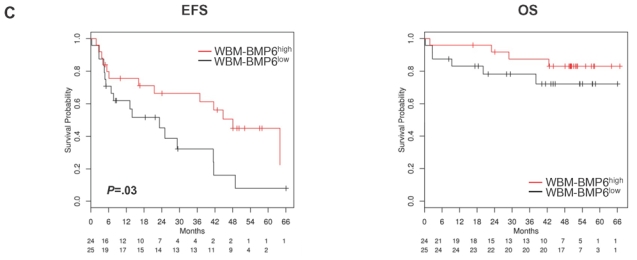
Pathogenesis of multiple myeloma is associated with an aberrant expression of pro-proliferative, pro-angiogenic and bone-metabolism-modifying factors by malignant plasma cells. Given the frequently long time span from diagnosis of early-stage plasma cell dyscrasias to overt myeloma and the mostly low proliferation rate of malignant plasma cells, we hypothesize these to similarly express a novel class of inhibitory factors of potential prognostic relevance. Bone morphogenic proteins (BMPs) represent possible candidates as they inhibit proliferation, stimulate bone formation and have an effect on the survival of cancer patients. We assessed the expression of BMPs and their receptors by Affymetrix DNA microarrays (n=779) including CD138-purified primary myeloma cell samples (n=635) of previously untreated patients. BMP6 is the only BMP expressed by malignant and normal plasma cells. Its expression is significantly lower in proliferating myeloma cells, myeloma cell lines or plasmablasts. BMP6 significantly inhibits the proliferation of myeloma cell lines, survival of primary myeloma cells and in vitro angiogenesis. A high BMP6 expression in primary myeloma cell samples delineates significantly superior overall survival for patients undergoing high-dose chemotherapy independent of conventional prognostic factors (International Staging System (ISS) stage, beta(2) microglobulin).


Conflict of interest statement

Conflict of interest

The authors declare no conflict of interests.

Figures

Figure 1
Figure 1. Expression of BMP6, BMP-receptors and SMADs and validation of gene expression by flow cytometry and western blotting
(A1–3) Expression of BMP6, ACVR1, BMPR2, BMPR1A, ACVR2A, ACVR2B, SMAD1, SMAD4 and SMAD5 in normal plasma cells (BMPCs), memory B-cells (MBCs), polyclonal plasmablastic cells (PPCs), myeloma cells (MMCs) and human myeloma cell lines (HMCLs) within the Heidelberg/Montpellier-group 1 (HM1). For HM2, see Supplementary Figure S1. SMAD8 is neither expressed in HM1 nor HM2. (B) To validate gene expression data, intracytoplasmatic expression of BMP6 was determined by flow cytometry. Shown are the cell lines (B1) XG-10, (B2) XG-11 and (B3) U266; the first shows a consistent absence of BMP6 by gene expression profiling, quantitative real-time PCR and flow cytometry, the other two a consistent expression. (B4) Expression of BMP6 by an exemplary myeloma patient (pMMC). Light gray line: control without primary antibody, black line: measurement with corresponding primary and secondary antibody. (C) Phosphorylation of downstream SMADs can be seen within 15 min. following incubation with BMP6. After pre-incubation with heparin, no SMAD-phosphorylation is detectable. Consistent with the literature, SMAD-2 is not phosphorylated. Actin was used as loading control.
Figure 2
Figure 2. Binding of BMP6 to human myeloma cell lines
The myeloma cell line U266 was incubated with primary anti-BMP6 antibody and secondary PE-labeled antibody, pre-incubated with BMP6, or pre-incubated with BMP6 plus heparin, respectively. Light grey line: control, black line: BMP6, primary and secondary antibody ± heparin. A strong labeling of U266 was found, whereas binding is reduced by incubation with heparin.
Figure 3
Figure 3. Inhibition of proliferation and induction of apoptosis of myeloma cell lines by BMP6 as well as survival of primary myeloma cells
(A) Inhibition of proliferation of myeloma cell lines by BMP6 in graded concentrations vs. medium control measured by 3H-thymidine uptake. The IC50 (in μg/ml) and the maximal inhibition at 4 μg/ml (IMAX4 in %) are for XG-1 n.a./57.2 %, XG-10 0.6 μg/ml/81.9 %, XG-11 0.08 μg/ml/88.6 %, 23 XG-13 0.525 μg/ml/74.8 %, XG-19 n.a./33.7 %, OPM-2 0.175 μg/ml/94.3 %, RPMI-8226 n.a./27.9 %, SKMM-2 0.155 μg/ml/86 %, U266 n.a./30.7 %, LP-1 2.125 μg/ml/51.7 %. The two bars for each concentration correspond to two independent experiments. (B) Induction of apoptosis by BMP6 as determined by annexin V-staining after 8, 24, 48 and 72 h (3rd row). Apoptosis induction is abrogated by heparin-treatment (4th row), whereas heparin alone did not influence apoptosis rate (2nd row). (C) Survival of primary myeloma cells (pMMC) cultured within their bone marrow microenvironment is significantly inhibited by BMP6 as determined by staining with anti-CD138-FITC and propidium iodine. An asterisk (*) indicates a significant decrease between the medium control and the respective BMP6 concentration. (D) Increasing levels of cleaved caspase-3, -8 and -9 can be detected after BMP6 treatment for 48 and 72 h, respectively. This effect is abrogated by pre-treatment with heparin. Actin was used as loading control. (E) The proliferation rate of HMCLs can be increased using the BMP6-inhibitors noggin and sclerostin. As shown for U266, a highly BMP6-resistant and highly BMP6 expressing HMCL (see above), proliferation is concentration-dependently increased by both inhibitors, if cells are either co-exposed to exogenous BMP6, or endogenous BMP6-production is inhibited. Therefore, production of BMP6 by myeloma cells contributes to the inhibition of their growth in vitro. An asterisk (*) indicates a significant increase between the medium control and the respective inhibitor concentration (without exogenous BMP6) or between the BMP6-control and the respective inhibitor concentration (with 1 μg/ml BMP6).
Figure 4
Figure 4. Inhibition of in vitro induction of angiogenesis by BMP6
Inhibition of endothelial cell growth by BMP6 in the AngioKit model. Immunostaining with monoclonal anti-CD31 antibody. (A) Shown are medium control (RPMI-1640), positive control (vascular endothelial growth factor), negative control (suramin) and BMP6 in concentrations of 4, 0.8, 0.16 and 0.032 μg/ml, respectively. Original magnification ×40. (B) Boxplot summarizing the CD31 ELISA results. BMP6 significantly inhibits tubule formation down to the level of the negative control.
Figure 5
Figure 5. Effect of BMP6-expression on event-free and overall survival
(A) Event-free (EFS) and (B) overall survival (OS) for our patients (HM-group; n=168) and the Little Rock-group (LR-group; n=345). All patients are treated with high-dose chemotherapy and autologous stem cell transplantation. Two groups of patients with high (BMP6high, greater or equal the median, red curve) and low (BMP6low, below the median, black curve) BMP6-expression. The OS is significantly superior for high BMP6-expression (P=.02 HM1 and HM2, P=.03 LR-group). (C) EFS and OS for BMP6-expression within the whole bone marrow (WBM; n=57). The EFS is significantly superior for the group of patients with BMP6-expression above the median (WBM-BMP6high, P=.03). This group shows also a tendency to better OS, which does not reach significance (P=.3), likely due to a low number of events.

Similar articles

Cited by

References

    1. Barlogie B, Tricot G, Rasmussen E, Anaissie E, van RF, Zangari M, Fassas A, Hollmig K, Pineda-Roman M, Shaughnessy J, Epstein J, Crowley J. Blood. 2006;107:2633–2638. - PubMed
    1. Blade J, Samson D, Reece D, Apperley J, Bjorkstrand B, Gahrton G, Gertz M, Giralt S, Jagannath S, Vesole D. Br J Haematol. 1998;102:1115–1123. - PubMed
    1. Caplan AI. J Cell Physiol. 2007;213:341–347. - PubMed
    1. Cheng H, Jiang W, Phillips FM, Haydon RC, Peng Y, Zhou L, Luu HH, An N, Breyer B, Vanichakarn P, Szatkowski JP, Park JY, He TC. J Bone Joint Surg Am. 2003;85-A:1544–1552. - PubMed
    1. Clement JH, Sanger J, Hoffken K. Int J Cancer. 1999;80:250–256. - PubMed

Publication types

MeSH terms