

Transcript profiling provides evidence of functional divergence and expression networks among ribosomal protein gene paralogs in Brassica napus
- PMID: 19706795
- PMCID: PMC2751962
- DOI: 10.1105/tpc.109.068411
Transcript profiling provides evidence of functional divergence and expression networks among ribosomal protein gene paralogs in Brassica napus
Abstract
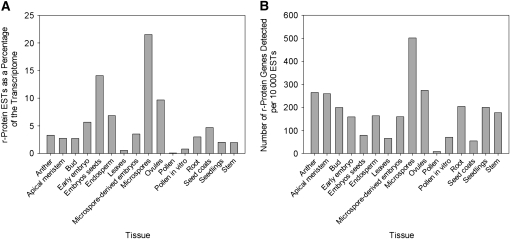
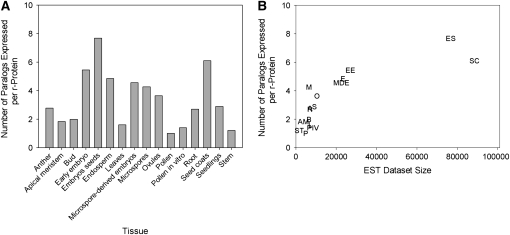
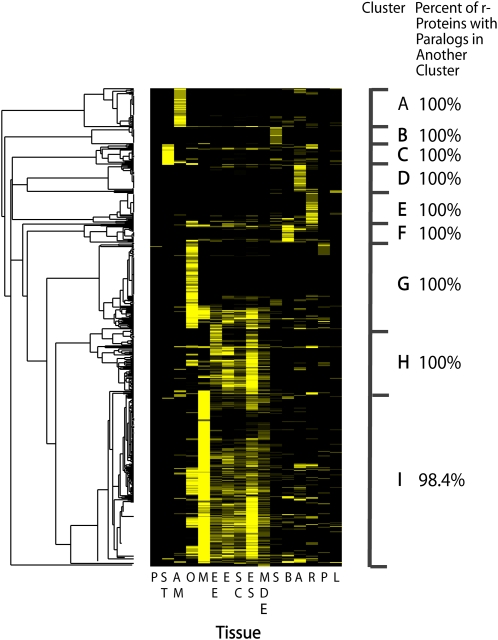
The plant ribosome is composed of 80 distinct ribosomal (r)-proteins. In Arabidopsis thaliana, each r-protein is encoded by two or more highly similar paralogous genes, although only one copy of each r-protein is incorporated into the ribosome. Brassica napus is especially suited to the comparative study of r-protein gene paralogs due to its documented history of genome duplication as well as the recent availability of large EST data sets. We have identified 996 putative r-protein genes spanning 79 distinct r-proteins in B. napus using EST data from 16 tissue collections. A total of 23,408 tissue-specific r-protein ESTs are associated with this gene set. Comparative analysis of the transcript levels for these unigenes reveals that a large fraction of r-protein genes are differentially expressed and that the number of paralogs expressed for each r-protein varies extensively with tissue type in B. napus. In addition, in many cases the paralogous genes for a specific r-protein are not transcribed in concert and have highly contrasting expression patterns among tissues. Thus, each tissue examined has a novel r-protein transcript population. Furthermore, hierarchical clustering reveals that particular paralogs for nonhomologous r-protein genes cluster together, suggesting that r-protein paralog combinations are associated with specific tissues in B. napus and, thus, may contribute to tissue differentiation and/or specialization. Altogether, the data suggest that duplicated r-protein genes undergo functional divergence into highly specialized paralogs and coexpression networks and that, similar to recent reports for yeast, these are likely actively involved in differentiation, development, and/or tissue-specific processes.
Figures
Similar articles
-
Comparative transcript analyses of the ovule, microspore, and mature pollen in Brassica napus.Plant Mol Biol. 2010 Feb;72(3):279-99. doi: 10.1007/s11103-009-9567-x. Epub 2009 Dec 1. Plant Mol Biol. 2010. PMID: 19949835
-
Gene expression profiling via LongSAGE in a non-model plant species: a case study in seeds of Brassica napus.BMC Genomics. 2009 Jul 3;10:295. doi: 10.1186/1471-2164-10-295. BMC Genomics. 2009. PMID: 19575793 Free PMC article.
-
A newly-developed community microarray resource for transcriptome profiling in Brassica species enables the confirmation of Brassica-specific expressed sequences.BMC Plant Biol. 2009 May 8;9:50. doi: 10.1186/1471-2229-9-50. BMC Plant Biol. 2009. PMID: 19426481 Free PMC article.
-
Gene expression at early stages of Brassica napus seed development as revealed by transcript profiling of seed-abundant cDNAs.Planta. 2004 Jan;218(3):483-91. doi: 10.1007/s00425-003-1124-2. Epub 2003 Oct 23. Planta. 2004. PMID: 14574574
-
Global analysis of gene expression profiles in Brassica napus developing seeds reveals a conserved lipid metabolism regulation with Arabidopsis thaliana.Mol Plant. 2009 Sep;2(5):1107-22. doi: 10.1093/mp/ssp042. Epub 2009 Jun 25. Mol Plant. 2009. PMID: 19825684
Cited by
-
High resolution RNA-seq profiling of genes encoding ribosomal proteins across different organs and developmental stages in Arabidopsis thaliana.Plant Direct. 2021 May 27;5(5):e00320. doi: 10.1002/pld3.320. eCollection 2021 May. Plant Direct. 2021. PMID: 34095740 Free PMC article.
-
Expression analyses of Brachiaria brizantha genes encoding ribosomal proteins BbrizRPS8, BbrizRPS15a, and BbrizRPL41 during development of ovaries and anthers.Protoplasma. 2013 Apr;250(2):505-14. doi: 10.1007/s00709-012-0433-3. Epub 2012 Jul 26. Protoplasma. 2013. PMID: 22833119
-
Dynamics of ribosome composition and ribosomal protein phosphorylation in immune signaling in Arabidopsis thaliana.Nucleic Acids Res. 2023 Nov 27;51(21):11876-11892. doi: 10.1093/nar/gkad827. Nucleic Acids Res. 2023. PMID: 37823590 Free PMC article.
-
Genetic dissection of leaf development in Brassica rapa using a genetical genomics approach.Plant Physiol. 2014 Mar;164(3):1309-25. doi: 10.1104/pp.113.227348. Epub 2014 Jan 6. Plant Physiol. 2014. PMID: 24394778 Free PMC article.
-
Gel-free proteomic analysis of soybean root proteins affected by calcium under flooding stress.Front Plant Sci. 2014 Oct 20;5:559. doi: 10.3389/fpls.2014.00559. eCollection 2014. Front Plant Sci. 2014. PMID: 25368623 Free PMC article.
References
-
- Akashi, H. (2001). Gene expression and molecular evolution. Curr. Opin. Genet. Dev. 11 660–666. - PubMed
-
- Arabidopsis Genome Initiative (2000). Analysis of the genome sequence of the flowering plant Arabidopsis thaliana. Nature 408 796–815. - PubMed
-
- Aury, J.M., et al. (2006). Global trends of whole-genome duplications revealed by the ciliate Paramecium tetraurelia. Nature 444 171–178. - PubMed
MeSH terms
Substances
LinkOut - more resources
Full Text Sources
Research Materials
