. 2009 Aug;21(8):2503-16.
doi: 10.1105/tpc.108.064519. Epub 2009 Aug 21.

Nuclear pore complex component MOS7/Nup88 is required for innate immunity and nuclear accumulation of defense regulators in Arabidopsis

Affiliations

Nuclear pore complex component MOS7/Nup88 is required for innate immunity and nuclear accumulation of defense regulators in Arabidopsis

Yu Ti Cheng et al. Plant Cell. 2009 Aug.

Abstract

Plant immune responses depend on dynamic signaling events across the nuclear envelope through nuclear pores. Nuclear accumulation of certain resistance (R) proteins and downstream signal transducers are critical for their functions, but it is not understood how these processes are controlled. Here, we report the identification, cloning, and analysis of Arabidopsis thaliana modifier of snc1,7 (mos7-1), a partial loss-of-function mutation that suppresses immune responses conditioned by the autoactivated R protein snc1 (for suppressor of npr1-1, constitutive 1). mos7-1 single mutant plants exhibit defects in basal and R protein-mediated immunity and in systemic acquired resistance but do not display obvious pleiotropic defects in development, salt tolerance, or plant hormone responses. MOS7 is homologous to human and Drosophila melanogaster nucleoporin Nup88 and resides at the nuclear envelope. In animals, Nup88 attenuates nuclear export of activated NF-kappaB transcription factors, resulting in nuclear accumulation of NF-kappaB. Our analysis shows that nuclear accumulation of snc1 and the defense signaling components Enhanced Disease Susceptibility 1 and Nonexpresser of PR genes 1 is significantly reduced in mos7-1 plants, while nuclear retention of other tested proteins is unaffected. The data suggest that specifically modulating the nuclear concentrations of certain defense proteins regulates defense outputs.


Figures

Figure 1.
Figure 1.
mos7-1 Suppresses the Autoimmune Responses in snc1. (A) Morphology of 5-week-old soil-grown plants of Col, snc1, and mos7-1 snc1. (B) PR gene expression in mos7-1 snc1. RNAs were prepared from 3-week-old plants grown on Murashige and Skoog media and reverse transcribed to obtain total cDNA. The cDNA samples were normalized by real-time PCR using Actin1. PR-1, PR-2, and Actin1 were amplified by 31 cycles of PCR using equal amounts of total cDNA, and the products were analyzed by agarose gel electrophoresis with ethidium bromide staining. (C) Two-week-old soil-grown seedlings were inoculated with H.a. Noco2 at a concentration of 50,000 conidia per mL of water, and the number of conidia was quantified 7 d after inoculation. Bars represent means of four replicates ± sd. (D) Five-week-old soil-grown plants were infiltrated with P.s.m. ES4326 (OD600 = 0.0001), and colony-forming units (cfu) were quantified at 0 and 3 d after inoculation, respectively. Bars represent means of six replicates ± sd. All data were analyzed by one-way analysis of variance. Different letters indicate statistically significant differences between genotypes (P < 0.05). (E) and (F) Free (E) and total (F) SA were extracted from 5-week-old plants and analyzed by HPLC. Bars represent the average of four replicates ± sd.
Figure 2.
Figure 2.
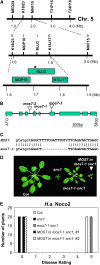
Map-Based Cloning of mos7-1. (A) Map position of the mos7-1 locus on chromosome 5. BAC clones and number of recombinants are indicated. Asterisk indicates the physical location of the mos7-1 locus. (B) Gene structure of At5g05680. The exons are indicated by boxes, and the introns are represented by solid lines. Locations of mos7-1 deletion and T-DNA insertions of mos7-2 (SALK_129301) and mos7-3 (SALK_085349) are indicated. (C) mos7-1 deletion at the DNA level. Lowercase and uppercase letters indicate intron and exon, respectively. (D) Morphology of wild-type Col, snc1, mos7-1 snc1, and a representing transgenic line containing MOS7 transgene driven by its native promoter in snc1 mos7-1. (E) Resistance of Col, snc1, mos7-1 snc1, and a MOS7 complementing line in snc1 mos7-1 against H.a. Noco2. The infection was rated as follows on 20 plants 7 d after infection by counting the number of conidiophores per infected leaf: 0, no conidiophores on the plants; 1, no more than five conidiophores per infected leaf; 2, 6 to 20 conidiophores on a few of the infected leaves; 3, 6 to 20 conidiophores on most of the infected leaves; 4, five or more conidiophores on all infected leaves; 5, 20 or more conidiophores on all infected leaves. [See online article for color version of this figure.]
Figure 3.
Figure 3.
Altered Basal and R Protein–Mediated Resistance in mos7-1 Single Mutant Plants. (A) Enhanced disease susceptibility to P.s.m. ES4326 in mos7-1. The plants were infiltrated with the bacteria at OD600 = 0.0001. Leaf discs within the infiltrated area were taken at days 0 and 3 to measure the bacterial growth. Bars represent means of six replicates ± sd. Susceptibility toward P.s.m. ES4326 in mos7-1 is significantly enhanced compared with Col, as indicated by the asterisk (P < 0.0001, t test). (B) to (E) mos7-1 mutant plants were challenged with the indicated avirulent pathogens carrying effectors that can trigger the cognate R protein–mediated resistance. (B) 50,000 conidia/mL was used for H.a. Emwa1 inoculation. (C) to (E) For bacterial pathogens, an inoculation dose of OD600 = 0.002 was used. Bars represent means of six replicates ± sd. Statistical analyses of the bacterial growth assays were done by one-way analysis of variance provided by StatsDirect statistical software (StatsDirect). Statistical differences among the samples are labeled with different letters (P < 0.05).
Figure 4.
Figure 4.
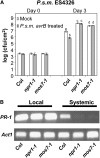
SAR Is Compromised in mos7-1. (A) Growth of P.s.m. ES4326 in 5-week-old Col, npr1-1, and mos7-1 plants preinoculated with P.s.m. ES4326 avrB in 10 mM MgCl2 (gray bars) or 10 mM MgCl2 alone (mock; white bars). Bars represent means of four replicates ± sd. Different letters indicate statistically significant differences between genotypes (P < 0.05). (B) RT-PCR for PR-1 on RNA extracted from local and systemic leaves of the indicated genotypes pretreated with P.s.m. ES4326 avrB. Actin1 was used as control. PCR conditions are as described in Figure 1B.
Figure 5.
Figure 5.
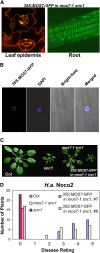
Subcellular Localization of MOS7-GFP. (A) MOS7-GFP fluorescence in leaf pavement and root cells of mos7-1 snc1 transgenic plants expressing MOS7-GFP under the control of 35S promoter. Plant cell walls were stained with 5 mg/mL propidium iodine (red) in the left panel. (B) MOS7-GFP fluorescence, 4',6-diamidino-2-phenylindole (DAPI) staining of the nucleus, bright-field, and merged fluorescence channels in root cells. Pictures in (A) and (B) were taken on 2-week-old plate-grown plants. (C) Complementation of mos7-1 by MOS7-GFP expressed by the 35S promoter. (D) Restoration of enhanced disease resistance in mos7-1 snc1 transformed with MOS7-GFP driven by 35S promoter. The disease ratings are as described in Figure 2E.
Figure 6.
Figure 6.
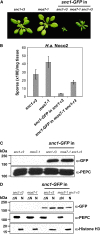
Abundance and Cellular Distribution of snc1-GFP in mos7-1 snc1-r3. (A) Morphology of 3-week-old plants of snc1-r3, mos7-1, snc1-GFP in snc1-r3, and snc1-GFP in mos7-1 snc1-r3. (B) H.a. Noco2 growth on the same genotypes as (A). (C) Immunoblot analysis of snc1-GFP expressed under its native promoter in total protein extracts of unchallenged leaf tissues in snc1-r3 and mos7-1 snc1-r3. Equal loading was monitored by probing the membrane with anti-phoshpo-enol-pyruvate carboxylase (PEPC). (D) Immunoblot analysis of snc1-GFP in nuclei-depleted (ΔN) and nuclear (N) protein extracts of the indicated genotypes. Anti-PEPC was used as a cytosolic marker, and anti-Histone H3 was used as a nuclear marker. Nuclear protein extracts (N) were 20× concentrated compared with nuclei-depleted fractions (ΔN). The experiment was repeated five times; a figure representative of all repetitions is shown. Various exposure times on films were used to make sure that the figure shown was in the linear range. [See online article for color version of this figure.]
Figure 7.
Figure 7.
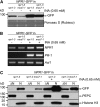
NPR1 Protein Abundance and Subcellular Localization in mos7-1. (A) NPR1-GFP expressed by its native promoter in mos7-1. Immunoblot analysis of NPR1-GFP in total protein extracts of unchallenged leaf tissues (−) and leaf tissues harvested 24 h after spraying plants with 0.65 mM INA (+). Equal loading was monitored by staining the membrane with Ponceau S. (B) RT-PCR for NPR1 and PR-1 on RNA extracted from 4-week-old plants of the indicated genotypes treated with (+) or without (−) INA. Actin1 expression was used as control. NPR1 and Actin1 were amplified by 29 cycles of PCR and PR-1 by 30 cycles of PCR using equal amounts of cDNA. PCR products were analyzed by agarose gel electrophoresis and ethidium bromide staining. (C) Immunoblot analysis of NPR1-GFP in nuclei-depleted (ΔN) and nuclear (N) protein extracts of unchallenged (−) and INA treated (+) tissues of the indicated genotypes. Anti-PEPC was used as a cytosolic marker, and anti-Histone H3 was used as a nuclear marker. Nuclear protein extracts (N) were 35× concentrated compared with nuclei-depleted fractions (ΔN). The experiment was repeated twice with similar results.
Figure 8.
Figure 8.
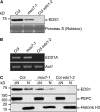
EDS1 Protein Abundance and Subcellular Localization in mos7-1. (A) EDS1 in mos7-1. Immunoblot analysis of EDS1 in total protein extracts of unchallenged leaf tissues. Equal loading was monitored by staining the membrane with Ponceau S. (B) RT-PCR for EDS1A on RNA extracted from 4-week-old unchallenged plants of the indicated genotypes. Actin1 expression was used as control. EDS1 and Actin1 were amplified by 29 cycles of PCR using equal amounts of cDNA. PCR products were analyzed by agarose gel electrophoresis and ethidium bromide staining. (C) Immunoblot analysis of EDS1 in nuclei-depleted (ΔN) and nuclear (N) protein extracts of unchallenged leaf tissues. Anti-PEPC was used as a cytosolic marker, and anti-Histone H3 was used as a nuclear marker. Nuclear protein extracts (N) were 35× concentrated compared with nuclei-depleted fractions (ΔN). The experiment was repeated twice with similar results.
Figure 9.
Figure 9.
CDC5, PEPC, HDA19, TGA2, and Histone H3 Protein Abundance and Subcellular Localization Is Unaltered in mos7-1. Immunoblot analysis of CDC5, PEPC, HDA19, TGA2, and Histone H3 in nuclei-depleted (ΔN) and nuclear (N) protein extracts of unchallenged leaf tissues. Anti-PEPC was used as a cytosolic marker, and anti-Histone H3 was used as a nuclear marker. Nuclear protein extracts (N) were 35× concentrated compared with nuclei-depleted fractions (ΔN).

Similar articles

Cited by

References

    1. Aarts, N., Metz, M., Holub, E., Staskawicz, B.J., Daniels, M.J., and Parker, J.E. (1998). Different requirements for EDS1 and NDR1 by disease resistance genes define at least two R gene-mediated signaling pathways in Arabidopsis. Proc. Natl. Acad. Sci. USA 95: 10306–10311. - PMC - PubMed
    1. Axtell, M.J., and Staskawicz, B.J. (2003). Initiation of RPS2-specified disease resistance in Arabidopsis is coupled to the AvrRpt2-directed elimination of RIN4. Cell 112: 369–377. - PubMed
    1. Belkhadir, Y., Subramaniam, R., and Dangl, J.L. (2004). Plant disease resistance protein signaling: NBS-LRR proteins and their partners. Curr. Opin. Plant Biol. 7: 391–399. - PubMed
    1. Bernad, R., van der Velde, H., Fornerod, M., and Pickersgill, H. (2004). Nup358/RanBP2 attaches to the nuclear pore complex via association with Nup88 and Nup214/CAN and plays a supporting role in CRM1-mediated nuclear protein export. Mol. Cell. Biol. 24: 2373–2384. - PMC - PubMed
    1. Burch-Smith, T.M., Schiff, M., Caplan, J.L., Tsao, J., Czymmek, K., and Dinesh-Kumar, S.P. (2007). A novel role for the TIR domain in association with pathogen-derived elicitors. PLoS Biol. 5: e68. - PMC - PubMed

Publication types

MeSH terms

Associated data