

Review
doi: 10.1016/j.semcdb.2009.08.006.
Epub 2009 Aug 19.
Fluorescence microscopy below the diffraction limit
Affiliations
- PMID: 19698798
- PMCID: PMC2784032
- DOI: 10.1016/j.semcdb.2009.08.006
Item in Clipboard
Review
Fluorescence microscopy below the diffraction limit
Semin Cell Dev Biol.
2009 Oct.
Abstract
Fluorescence imaging with conventional microscopy has experienced numerous advances in almost every limiting factor from sensitivity to speed. But improved resolution beyond the fundamental limitation of light diffraction has been elusive until recent years. Now, techniques are available that surpass this barrier and improve resolution up to 10 times over that of conventional microscopy. This chapter provides an overview of these new "super-resolution" imaging methods.
Figures
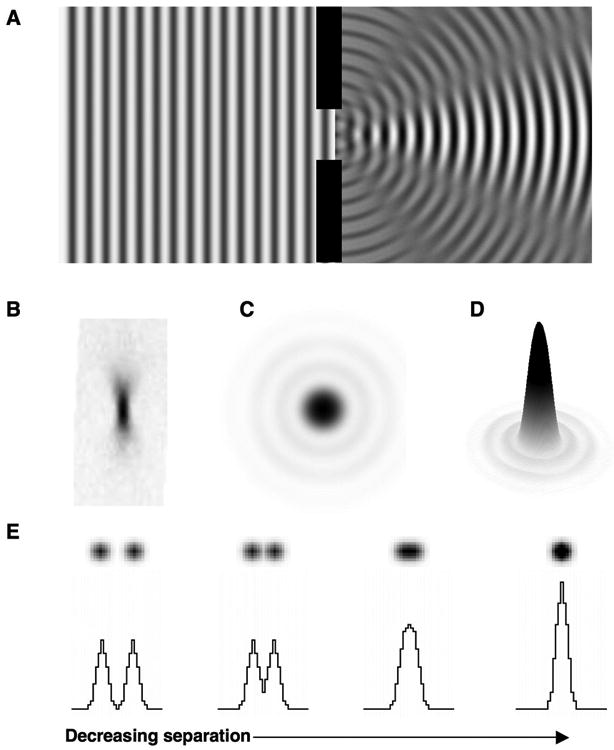
(A) When light is transmitted through a slit, it propagates radially upon exit. In this example, only five point source secondary wavefronts are depicted as the light exits the slit. The waves interfere constructively and destructively to produce a diffraction pattern. (B) Passage of light through an objective lens cannot focus the light to an infinitely small point as a consequence of transit through a circular aperture and this xz image of a 40 nm fluorescent bead demonstrates the resulting three-dimensional point spread function. (C) If PSF is projected onto a two-dimensional image, an Airy pattern with a bright central region and surrounding rings is produced. (D) This is the surface plot of the Airy pattern in (C). (E) Two fluorescent molecules will produce two observable spots >100 times larger than the molecules themselves. Plot profiles through the spots indicate the intensity distributions. As the two spots are moved closer together their summed intensities make difficult determining their individual fluorescent signals.
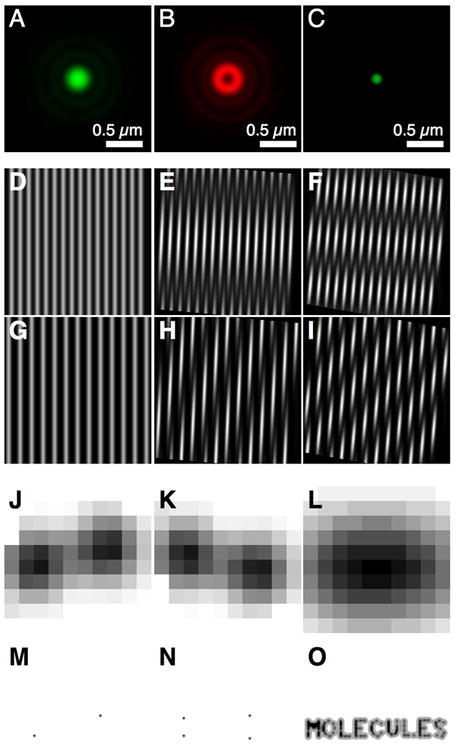
(A-C) Stimulated emission depletion microscopy (STED) uses one light source near the excitation maximum of a fluorophore. The Airy pattern of the excitation pulse is shown in (A). (B) A red-shifted light source with a zero node in the center of the Airy pattern and a wavelength located within the fluorophore's emission spectrum depopulates a subpopulation of molecules in the excited state. (C) The remaining excited fluorophores in the center of the Airy pattern are allowed to fluoresce normally. (D-I) Structured illumination microscopy (SIM) utilizes excitation of the sample with a known pattern of light, which produces Moiré fringes in the emission. Moiré fringes shown here are produced when a pattern is superimposed with another pattern oriented at various angles. The image in (D) was multiplied with itself with relative orientations of 5° (E) and 10° (F). The image in G has was also multiplied by the image in (D) rotated to 5° (H) and 10° (I). (J-O) High-density molecular localization relies on imaging single fluorescent molecules within a PSF. If the molecules can be imaged individually (J-K), their locations can be determined at sub-pixel precision using fits of their PSF (M-N). Several techniques, such as photoactivation and photoswitching, have been developed to “turn on” only a subset of molecules in maintaining the density of the fluorescent molecules low enough to distinguish single molecules. (O) Their calculated positions can then be plotted on an image using the uncertainty associated with the position information. By repeatedly or continuously “turning on” molecules, calculating their positions, and plotting them on a final image, super-resolution maps of structures can be produced or high precision dense molecular distributions can be determined and provide more information than simply imaging all molecules at once (L).
Similar articles
-
Breaking the diffraction barrier: super-resolution imaging of cells.Cell. 2010 Dec 23;143(7):1047-58. doi: 10.1016/j.cell.2010.12.002. Cell. 2010. PMID: 21168201 Free PMC article.
-
Super-resolution fluorescence microscopy.Annu Rev Biochem. 2009;78:993-1016. doi: 10.1146/annurev.biochem.77.061906.092014. Annu Rev Biochem. 2009. PMID: 19489737 Free PMC article. Review.
-
Pushing the super-resolution limit: recent improvements in microscopy below the diffraction limit.Biochem Soc Trans. 2021 Feb 26;49(1):431-439. doi: 10.1042/BST20200746. Biochem Soc Trans. 2021. PMID: 33599719 Review.
-
Recent advances in super-resolution fluorescence imaging and its applications in biology.J Genet Genomics. 2013 Dec 20;40(12):583-95. doi: 10.1016/j.jgg.2013.11.003. Epub 2013 Nov 23. J Genet Genomics. 2013. PMID: 24377865 Review.
-
Cell biology beyond the diffraction limit: near-field scanning optical microscopy.J Cell Sci. 2001 Dec;114(Pt 23):4153-60. doi: 10.1242/jcs.114.23.4153. J Cell Sci. 2001. PMID: 11739648 Review.
Cited by
-
Strategies to overcome the main challenges of the use of exosomes as drug carrier for cancer therapy.Cancer Cell Int. 2022 Oct 18;22(1):323. doi: 10.1186/s12935-022-02743-3. Cancer Cell Int. 2022. PMID: 36258195 Free PMC article. Review.
-
Quantifying spatial organization in point-localization superresolution images using pair correlation analysis.Nat Protoc. 2013 Feb;8(2):345-54. doi: 10.1038/nprot.2013.005. Epub 2013 Jan 24. Nat Protoc. 2013. PMID: 23348362 Free PMC article.
-
Alternative reagents to antibodies in imaging applications.Biophys Rev. 2017 Aug;9(4):299-308. doi: 10.1007/s12551-017-0278-2. Epub 2017 Jul 27. Biophys Rev. 2017. PMID: 28752365 Free PMC article. Review.
-
The power of correlative microscopy: multi-modal, multi-scale, multi-dimensional.Curr Opin Struct Biol. 2011 Oct;21(5):686-93. doi: 10.1016/j.sbi.2011.06.010. Epub 2011 Jul 21. Curr Opin Struct Biol. 2011. PMID: 21782417 Free PMC article.
-
A Comparative Study to Visualize PtdIns(4,5) P2 and PtdIns(3,4,5) P3 in MDA-MB-231 Breast Cancer Cell Line.Rep Biochem Mol Biol. 2022 Jan;10(4):518-526. doi: 10.52547/rbmb.10.4.518. Rep Biochem Mol Biol. 2022. PMID: 35291610 Free PMC article.
References
-
- Ditchburn RW. Light. 1991:42–70.
-
- Gustafsson MG, Agard DA, Sedat JW. I5M: 3D widefield light microscopy with better than 100 nm axial resolution. J Microsc. 1999;195:10–6. - PubMed
-
- Bailey B, et al. Enhancement of axial resolution in fluorescence microscopy by standing-wave excitation. Nature. 1993;366:44–8. - PubMed
-
- Hell SW, Schrader M, van der Voort HT. Far-field fluorescence microscopy with three-dimensional resolution in the 100-nm range. J Microsc. 1997;187:1–7. - PubMed
Publication types
MeSH terms
Grants and funding
LinkOut - more resources
Full Text Sources
Other Literature Sources
