. 2009 Aug 21;4(8):e6713.
doi: 10.1371/journal.pone.0006713.

Chemoattractant signaling between tumor cells and macrophages regulates cancer cell migration, metastasis and neovascularization

Affiliations

Chemoattractant signaling between tumor cells and macrophages regulates cancer cell migration, metastasis and neovascularization

Chad E Green et al. PLoS One. .

Abstract

Tumor-associated macrophages are known to influence cancer progression by modulation of immune function, angiogenesis, and cell metastasis, however, little is known about the chemokine signaling networks that regulate this process. Utilizing CT26 colon cancer cells and RAW 264.7 macrophages as a model cellular system, we demonstrate that treatment of CT26 cells with RAW 264.7 conditioned medium induces cell migration, invasion and metastasis. Inflammatory gene microarray analysis indicated CT26-stimulated RAW 264.7 macrophages upregulate SDF-1alpha and VEGF, and that these cytokines contribute to CT26 migration in vitro. RAW 264.7 macrophages also showed a robust chemotactic response towards CT26-derived chemokines. In particular, microarray analysis and functional testing revealed CSF-1 as the major chemoattractant for RAW 264.7 macrophages. Interestingly, in the chick CAM model of cancer progression, RAW 264.7 macrophages localized specifically to the tumor periphery where they were found to increase CT26 tumor growth, microvascular density, vascular disruption, and lung metastasis, suggesting these cells home to actively invading areas of the tumor, but not the hypoxic core of the tumor mass. In support of these findings, hypoxic conditions down regulated CSF-1 production in several tumor cell lines and decreased RAW 264.7 macrophage migration in vitro. Together our findings suggest a model where normoxic tumor cells release CSF-1 to recruit macrophages to the tumor periphery where they secrete motility and angiogenic factors that facilitate tumor cell invasion and metastasis.


Conflict of interest statement

Competing Interests: The authors have declared that no competing interests exist.

Figures

Figure 1
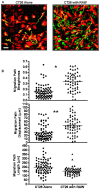
Figure 1. Macrophages elicit directed migration of colon cancer cells in vitro.
A,B) CT26-DsRed (105/ml) were incubated on fibronectin with RAW 264.7-GFP (105/ml), as indicated, for 12 hrs at 37°C. During this time, the straightness, total length traveled and total cumulative displacement of individual CT26 cell centroids were tracked (yellow lines) at 4 frames/hr in the presence and absence of RAW 264.7 macrophages using confocal microscopy at 20X. Data is presented as individual track quantitation for 55–75 cells over 3 experiments, with average indicated by bar. Magnification scale bar represents 30 µm. * denotes significant difference in migration path straightness (p<0.0001). ** denotes significant difference in migration path displacement (p<0.0001).
Figure 2
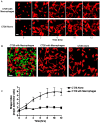
Figure 2. Colon cancer cells exhibit elongated protrusions when cultured with macrophages in vitro.
DsRed-CT26 (105/ml) were incubated on fibronectin with GFP-RAW 264.7 (105/ml), as indicated, for 15 hrs at 37°C. Fluorescent images were acquired using confocal microscopy (20X) at 4 frames/hr. A) Time course of Ds-Red-CT26 dynamics over 12 hrs when incubated alone or with RAW 264.7-GFP macrophages. Images are representative of CT26 movement over 3 separate experiments. Magnification scale bar represents 20 µm. B) Cumulative CT26-DsRed distribution and protrusion after 15 hrs of incubation alone (right) or with RAW 264.7-GFP macrophages (left and center, with green channel turned off). Images are representative of 3 separate experiments. Magnification scale bar represents 30 µm. C) The shape index (major axis/minor axis) of CT26 cells in the presence or absence of RAW 264.7 cells was tracked over 12 hrs of migration. Data represents the average±SEM for 10 cells over 3 separate experiments.
Figure 3
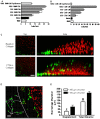
Figure 3. Macrophages and colon cancer cells chemotax to soluble cues.
A) CT26 (105/ml) were added to the upper of a Boyden chamber with RAW 264.7 conditioned media, control buffer or complete DMEM added to the lower well. CT26 were allowed to migrate for 3 hrs at 37°C prior to staining and quantitation of chemotaxis. Data represents the average±SEM for 15–30 randomly selected fields over 3–6 separate experiments. * denotes significance between 50% RAW CM and media control (p<0.001) and 50% RAW CM and 100% RAW CM top/bottom (p<0.001). B) RAW 264.7 (105/ml) were added to the upper well of a Boyden chamber with CT26 conditioned media, control buffer or complete DMEM added to the lower well. RAW 264.7 were allowed to migrate for 24 hrs at 37°C prior to staining and quantitation of chemotaxis. Data represents average±SEM for 15–30 randomly selected fields over 3–6 separate experiments. ** denotes significance between 25% CT26 CM and media control (p<0.001) and 25% CT26 CM and 100% CT26 CM top/bottom (p<0.001). C) GFP-RAW 264.7 (105/ml) were incubated on fibronectin coated chamber slides with 10 µl collagen drops containing Ds-Red-CT26 (107/ml) or 10 µm red fluorescent beads (107/ml). Macrophage invasion into the tumor embedded or bead embedded collagen drop was imaged after 7 days at 10X by confocal microscopy. Side view and top view images are representative of the average macrophage response over 6 collagen tumors. Magnification scale bar for top view images represents 200 µm. D) The interface between macrophages and the collagen tumor drop was imaged using confocal microscopy (20X) for 12 hrs at 4 frames/hr following addition of RAW 264.7 to the chamber slide. Over this time, the dynamics of macrophage migration was quantitated by tracking individual cell centroids at 4 frames/hr. Macrophages initiating migration within 100 µm of the tumor boundary (dashed white line) exhibit yellow tracks. Macrophages initiating migration beyond 100 µm of the tumor boundary exhibit white tracks. Image is representative of the average macrophage response to 6 separate collagen tumors. Magnification scale bar represents 30 µm. E) Track displacement and total track length was quantitated for macrophage migration within and beyond 100 µm of the collagen tumor boundary. Data represents the average±SEM for 15 macrophages within 100 µm and 15 macrophages beyond 100 µm of the collagen tumor boundary. #denotes a significant difference in migration path displacement (p<0.05). ##denotes a significant difference in total migration path length (p<0.0001).
Figure 4
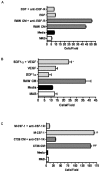
Figure 4. CSF-1, VEGF and SDF-1α mediate reciprocal chemotaxis between macrophages and tumor cells.
A) CT26 (105/ml) were added to the upper of a Boyden chamber with RAW 264.7 conditioned media, 100 ng/ml EGF in migration buffer, control migration buffer or complete DMEM added to the lower well. Anti-EGFR was present in both the top and bottom wells, as indicated, throughout the experiment. CT26 were allowed to migrate for 3 hrs at 37°C prior to staining and quantitation of chemotaxis. Data represents the average±SEM for 15–30 randomly selected fields over 3–6 separate experiments. B) CT26 (105/ml) were added to the upper of a Boyden chamber with 100 ng/ml SDF-1α, 10 ng/ml VEGF, SDF-1α+VEGF, RAW 264.7 conditioned media, control migration buffer or complete DMEM added to the lower well. SDF-1α and VEGF were suspended in serum-free migration buffer. CT26 were allowed to migrate for 3 hrs at 37°C prior to staining and quantitation of chemotaxis. Data represents the average±SEM for 15–30 randomly selected fields over 3–6 separate experiments. * denotes significance between SDF-1α with VEGF compared to SDF-1α (p<0.05) or VEGF alone (p<0.05). C) RAW 264.7 (105/ml) were added to the upper well of a Boyden chamber with 40 ng/ml CSF-1, CT26 conditioned media, control buffer or complete DMEM added to the lower well. CSF-1 was suspended in serum-free migration buffer. Anti-CSF-1R was present in both top and bottom wells, as indicated, throughout the assay. RAW 264.7 were allowed to migrate for 24 hrs at 37°C prior to staining and quantitation of chemotaxis. Data represents average±SEM for 15–30 randomly selected fields over 3–6 separate experiments. #denotes significance between CSF-1 and CSF-1+anti-CSF-1R (p<0.0001). ##denotes significance between CT26 CM and CT26 CM+anti-CSF-1R (p<0.0001).
Figure 5
Figure 5. RAW 264.7 macrophages promote CT26 tumor formation, metastasis and neovascularization in the chick CAM.
A) CT26-DsRed (1.8×10⁶ cells) alone or together with RAW 264.7-GFP (2×10⁵ cells) were suspended in Matrigel then inoculated onto the chick CAM. After 11 days, the primary tumors were imaged at 0.63X and 2X by stereomicroscopy then removed, weighed and measured. Images are representative of tumors from 7–10 separate experiments. Magnification scale bar for the 0.63X images represents 3 mm. Magnification scale bar for the 2X images represents 1 mm. B) CT26 metastasis was quantitated by counting the cell clusters present in the chick lungs using confocal microscopy at 10X. Data represents the average±SEM for 14–16 lungs over 4–6 separate experiments. * denotes significance between primary tumors with CT26 alone compared to primary tumors with CT26 and RAW 264.7 (p<0.01). Explanted tumors were also analyzed for weight and volume. Data represents the average±SEM for 7–10 tumors over 4–6 separate experiments. ** denotes significance in weight between primary tumors with CT26 alone compared to primary tumors with CT26 and RAW 264.7 (p<0.001). *** denotes significance in volume between primary tumors with CT26 alone compared to primary tumors with CT26 and RAW 264.7 (p<0.001).
Figure 6
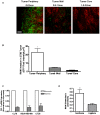
Figure 6. Analysis of Macrophage Localization in CT26 tumors In Vivo.
A) CT26-DsRed (1.8×10⁶ cells) together with RAW 264.7-GFP (2×10⁵ cells) were suspended in Matrigel then inoculated onto the CAM of chick embryos for 11 days. After 11 days, the primary tumors were sectioned and imaged at 10X across the Z-axis using confocal microscopy. Tumors were imaged 0 to 0.5 cm from the periphery (Tumor Periphery), 0.5 cm to 1 cm from the periphery (Tumor Wall) and 1.0 cm to 3 cm from the tumor periphery (Tumor Core). Images are representative of tumors from 7–10 separate experiments. Magnification scale bar represents 200 µm. B) RAW 264.7-GFP distribution within the CT26-DsRed tumors was determined by averaging pixel bit maps to produce a mean fluorescence intensity for each region of the tumor. Data represents the average±SEM for RAW 264.7-GFP distribution in tumors from 3 separate experiments. * denotes significance in pixel intensity between the tumor periphery region and the tumor wall region (p<0.001). C) CT26 and human breast cancer lines CL16, metastatic variant of MDA-MD-435 and MDA-MB-468 were incubated in 1% O2 for 24 hrs in standard media prior to mRNA extraction and qPCR. CSF-1 mRNA expression under hypoxic conditions is presented as a percentage of basal expression under normoxic conditions. HPRT-1 was used to normalize by global gene expression. Data represents the average±SEM from 3 separate experiments. D) RAW 264.7 (2×10⁵ cells) were added to the upper well of a Boyden chamber with complete DMEM added to the lower well. RAW 264.7 were allowed to migrate for 24 hrs at 37°C under normoxic (21% oxygen) or hypoxic (1% oxygen) conditions prior to crystal violet staining and quantitation of chemotaxis by absorbance at 570 nm. Data represents average±SEM for 15–30 randomly selected fields over 3 separate experiments. ** denotes significance between RAW 264.7 chemotaxis during hypoxic and normoxic conditions (p<0.05).
Figure 7
Figure 7. Proposed model for the role of tumor associated macrophages in cancer progression.
During tumor growth, macrophages home to normoxic regions at the tumor periphery in response to secreted CSF-1. The macrophages in turn release soluble chemokines that stimulate the tumor cells to release more CSF-1 creating a localized high concentration of CSF-1 that promotes further macrophage infiltration and survival at the tumor periphery. The close proximity of macrophages and tumor cells establishes a paracrine chemokine network at the tumor margin that results is at least two major outcomes. First, tumor cell migration and tissue invasion increases as the result of SDF-1α and VEGF release by tumor associated macrophages. Second, both tumor cells and macrophages are stimulated to release VEGF and TGFβ, which facilitates vessel growth, remodeling, and increased permeability. The increase in tumor cell invasiveness combined with structural changes in the surrounding vasculature provides optimal conditions for tumor cell intravasation and metastasis.

Similar articles

Cited by

References

    1. Tlsty TD, Coussens LM. Tumor stroma and regulation of cancer development. Annu Rev Pathol. 2006;1:119–150. - PubMed
    1. Pollard JW. Tumour-educated macrophages promote tumour progression and metastasis. Nat Rev Cancer. 2004;4:71–78. - PubMed
    1. Yamashiro S, Takeya M, Nishi T, Kuratsu J, Yoshimura T, et al. Tumor-derived monocyte chemoattractant protein-1 induces intratumoral infiltration of monocyte-derived macrophage subpopulation in transplanted rat tumors. Am J Pathol. 1994;145:856–867. - PMC - PubMed
    1. Sica A, Allavena P, Mantovani A. Cancer related inflammation: the macrophage connection. Cancer Lett. 2008;267:204–215. - PubMed
    1. Mantovani A, Sozzani S, Locati M, Allavena P, Sica A. Macrophage polarization: tumor-associated macrophages as a paradigm for polarized M2 mononuclear phagocytes. Trends Immunol. 2002;23:549–555. - PubMed

Publication types

Substances