. 2009 Sep 15;183(6):3932-41.
doi: 10.4049/jimmunol.0900227. Epub 2009 Aug 19.

CD4+ T cell help has an epitope-dependent impact on CD8+ T cell memory inflation during murine cytomegalovirus infection

Affiliations

CD4+ T cell help has an epitope-dependent impact on CD8+ T cell memory inflation during murine cytomegalovirus infection

Christopher M Snyder et al. J Immunol. .

Abstract

Murine CMV (MCMV) establishes a systemic, low-level persistent infection resulting in the accumulation of CD8(+) T cells specific for a subset of viral epitopes, a process called memory inflation. Although replicating virus is rarely detected in chronically infected C57BL/6 mice, these inflationary cells display a phenotype suggestive of repeated Ag stimulation, and they remain functional. CD4(+) T cells have been implicated in maintaining the function and/or number of CD8(+) T cells in other chronic infections. Moreover, CD4(+) T cells are essential for complete control of MCMV. Thus, we wondered whether CD4(+) T cell deficiency would result in impaired MCMV-specific CD8(+) T cell responses. Here we show that CD4(+) T cell deficiency had an epitope-specific impact on CD8(+) T cell memory inflation. Of the three codominant T cell responses during chronic infection, only accumulation of the late-appearing IE3-specific CD8(+) T cells was substantially impaired in CD4(+) T cell-deficient mice. Moreover, the increased viral activity did not drive increased CD8(+) T cell division or substantial dysfunction in any MCMV-specific population that we studied. These data show that CD4(+) T cell help is needed for inflation of a response that develops only during chronic infection but is otherwise dispensable for the steady state maintenance and function of MCMV-specific CD8(+) T cells.


Conflict of interest statement

Disclosures

The authors have no financial conflict of interest.

Figures

FIGURE 1
FIGURE 1
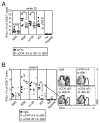
Memory inflation is inhibited by CD4+ T cell deficiency in an epitope-dependent manner. Mice were infected, and the percent of CD8+ T cells specific for the indicated peptides was measured in the blood over time by intracellular cytokine staining for IFN-γ. For each sample, responses were compared with unstimulated CD8+ T cells from the same animal (not shown), and gates were typically set to include <0.1% of these unstimulated CD8+ T cells. Each symbol represents an individual mouse. Significance was measured by Student’s t test. **, p < 0.05; ***, p < 0.001.
FIGURE 2
FIGURE 2
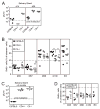
The reduction of IE3- and m139-specific T cells can be measured by tetramer staining. A, IE3-specific T cells in the peripheral blood, spleen, and lungs were measured by tetramer staining. Data are combined from several experiments, and mice were infected for 3–10 mo. B, m139-specific T cells were measured by tetramer staining as in A. C and D, The number of Ag-specific T cells was measured in the spleens of B6, MHC II−/−, and CD4−/− mice by tetramer staining. Data are combined from two independent experiments (MHC II−/−) or a single experiment (CD4−/−). Significance was measured as in Fig. 1.
FIGURE 3
FIGURE 3
IE3-specific T cell inflation occurs when CD4+ T cells are depleted during chronic infection. A, CD4+ T cells were depleted (αCD4) from B6 mice beginning on day (d) −3 and depletion was continued to day 21 (experiment #1) or 28 (experiment #2). Control mice were left untreated (UnTx). Analysis of the T cells in the peripheral blood was performed as in Fig. 1 after 22 wk, and data were combined from the two experiments. B, CD4+ T cells were continuously depleted from μMT mice beginning on day −4 or day 21, and peripheral blood T cells were measured by intracellular cytokine analysis after 8 wk. In one mouse, depletion of CD4+ T cells was incomplete. Responses from this mouse are indicated by an X within the gray circles (e.g., arrow), and the FACS plot of CD4+ T cells from this mouse, along with representative FACS plots from the other groups are shown. If this animal is not included in the group, the reduction in IE3-specific T cells between rIgG-treated and day 21 to day 56-depleted approaches significance (p = 0.0869). Statistical significance was measured as in Fig. 1.
FIGURE 4
FIGURE 4
CD40L and OX40 molecules impact inflation of IE3-specific T cells. IE3-specific T cells in the peripheral blood of the indicated mice were measured by tetramer staining and IFN-γ production. CD40L−/− mice and controls were analyzed 24 wk postinfection. OX40−/− mice and controls were analyzed 14 wk postinfection. Statistical significance was measured as in Fig. 1.
FIGURE 5
FIGURE 5
Inflationary T cells proliferate early but not late during MCMV infection regardless of the presence of CD4+ T cell help. A, The replicating virus in the salivary gland of 14- and 28-day-infected wild-type B6, CD4−/− and MHC II−/− mice was measured by plaque assay. Dotted line, limit of detection in this assay. B, MCMV-infected mice were treated with BrdU from days 14–28, and the percent of peripheral blood, tetramer+ T cells that incorporated BrdU is shown. The dotted line was arbitrarily drawn at 40% to illustrate the difference between stable memory (M45- and M57-specific T cells) and inflationary (M38-, m139-, and IE3-specific T cells). There were insufficient numbers of IE3-specific T cells in MHC II−/− mice to accurately assess their BrdU incorporation. C, The replicating virus in the salivary gland of chronically infected (>5 mo) wild-type B6, CD4−/− and MHC II−/− mice was measured by plaque assay as in A. D, Chronically infected mice were treated with BrdU for 2 wk, and the percent of peripheral blood, tetramer+ T cells that incorporated BrdU is shown. Again, there were too few IE3-specific CD8+ T cells in MHC II−/− mice to accurately determine their BrdU incorporation. The dotted line was drawn at 40% BrdU incorporation for comparison with B.
FIGURE 6
FIGURE 6
There is some phenotypic evidence of persistent viral replication in CD4+ T cell-deficient mice. A, Ag-specific T cells from the peripheral blood of B6 and MHC II−/− mice were measured by tetramer staining were costained with the indicated Abs. Representative FACS plots are shown. Numbers indicate the percentage of gated cells in each quadrant. B, Combined phenotype data from two independent experiments (as in A) are shown. C, Tetramer+ T cells from the spleens of B6 and MHC II−/− mice were costained with PD-1-specific Abs. Representative FACS plots are shown. D, Mean fluorescence intensity of PD-1 staining (as in C) is shown for tetramer+, CD8+ T cells for four mice per group.
FIGURE 7
FIGURE 7
Differentiated T cells express lower amounts of IFN-γ per cell after peptide stimulation. A, Representative FACS plots of CD8+ T cells from the peripheral blood stimulated with the indicated peptide and costained with Abs specific for NKG2A/C/E. Quadrants were drawn to illustrate the segregation of low and high IFN-γ expression by NKG2A+ and NKG2A CD8+ T cells. B, Overall mean fluorescence intensity of IFN-γ staining after stimulation of peripheral blood T cells with the indicated peptides for B6 and MHC II−/− mice.
FIGURE 8
FIGURE 8
Inflationary T cells retain the ability to secrete effector cytokines in CD4+ T cell-deficient mice. A, The percent of peripheral blood CD8+ T cells as measured by tetramer staining and IFN-γ production was measured in the same animals at the same time. B and C, The CD8+ T cells from the peripheral blood that produce IFN-γ in response to the indicated peptides were gated and the percentage that also produce TNF-α was measured.
FIGURE 9
FIGURE 9
The presence or absence of m157 in the infecting virus does not affect the ability of Ag-specific CD8+ T cells to secrete effector cytokines. MHC II−/− mice were infected with m157rev (wild-type) or m157mut (m157 deficient) virus and analyzed in the peripheral blood after 22 wk of infection. A, The percent of peripheral blood CD8+ T cells as measured by tetramer staining and IFN-γ production was measured in the same animals at the same time. B, The CD8+ T cells that produce IFN-γ in response to the indicated peptides were gated, and the percentage that also produce TNF-α was measured.
FIGURE 10
FIGURE 10
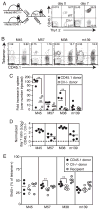
MCMV-specific CD8+ T cells from MHC II−/− mice expand poorly after viral challenge compared with CD8+ T cells from wild-type animals. CD8+ T cells from wild-type mice (Thy1.2+CD45.1+) or MHC II−/− mice (Thy1.2+CD45.2+) were transferred into naive Thy1.1-congenic mice. Recipients were challenged with MCMV 2 days after cell transfer (day 0), and donor CD8+ T cells were analyzed 7 days later. A, Representative FACS plots show that wild-type cells (Thy1.2+CD45.1+, upper right quadrant) and MHC II−/− cells (Thy1.2+CD45.1, lower right quadrant) were present in equal numbers on day 0, but not on day 7. Numbers indicate the percentage of all CD8+ T cells in the peripheral blood. B, Representative FACS plots of donor T cells from wild-type mice (CD45.1+, right quadrants), or MHC II−/− mice (CD45.1, left quadrants) are shown with the indicated tetramer staining. Numbers indicate the percent of all donor (Thy1.2+) CD8+ T cells that are tetramer+. C, MCMV-specific CD8+ T cells from wild-type and MHC II−/− mice undergo unequal expansion after viral challenge. The number of transferred Ag-specific cells (day 0 values) and the number of Ag-specific CD8+ T cells present in the spleen on day 7 were calculated for each donor population in each recipient mouse. Shown is the fold increase in tetramer+ donor populations between the adoptive transfer and day 7 postchallenge. Statistical significance was determined as in Fig. 1. D, Wild-type T cells expand more than CD8+ T cells from MHC II−/− mice in each animal. The ratio of wild-type to MHC II−/− Ag-specific T cells in the spleen 7 days after viral challenge was normalized to the ratio of cells that were injected (based on tetramer stains of the donor populations on the day of injection). Shown is the normalized data plotted on a log2 scale. The dotted line indicates a value of 1, which would result from equal expansion of the CD8+ T cells from wild-type and MHC II−/− mice. The fact that all values are above this line indicates that the wild-type donor CD8+ T cells expanded more than the CD8+ T cells from MHC II−/− mice in each animal. E, CD8+ T cells from wild-type and MHC II−/− mice incorporate similar amounts of BrdU after viral challenge. Mice were pulsed with BrdU 24 h before sacrifice. Shown is the percent of tetramer+ T cells in the spleen that incorporated BrdU. Statistical significance was calculated as in Fig. 1.

Similar articles

Cited by

References

    1. Holtappels R, Pahl-Seibert MF, Thomas D, Reddehase MJ. Enrichment of immediate-early 1 (m123/pp89) peptide-specific CD8 T cells in a pulmonary CD62Llo memory-effector cell pool during latent murine cytomegalovirus infection of the lungs. J Virol. 2000;74:11495–11503. - PMC - PubMed
    1. Karrer U, Sierro S, Wagner M, Oxenius A, Hengel H, Koszinowski UH, Phillips RE, Klenerman P. Memory inflation: continuous accumulation of antiviral CD8+ T cells over time. J Immunol. 2003;170:2022–2029. - PubMed
    1. Karrer U, Wagner M, Sierro S, Oxenius A, Hengel H, Dumrese T, Freigang S, Koszinowski UH, Phillips RE, Klenerman P. Expansion of protective CD8+ T-cell responses driven by recombinant cytomegaloviruses. J Virol. 2004;78:2255–2264. - PMC - PubMed
    1. Munks MW, Cho KS, Pinto AK, Sierro S, Klenerman P, Hill AB. Four distinct patterns of memory CD8 T cell responses to chronic murine cytomegalovirus infection. J Immunol. 2006;177:450–458. - PubMed
    1. Snyder CM, Cho KS, Morrison EL, van Dommelen S, Shellam GR, Hill AB. Memory inflation during chronic viral infection is maintained by continuous production of short-lived functional T cells. Immunity. 2008;29:650–659. - PMC - PubMed

Publication types