. 2009:5:294.
doi: 10.1038/msb.2009.52. Epub 2009 Aug 18.

Genomic analysis reveals a tight link between transcription factor dynamics and regulatory network architecture

Affiliations

Genomic analysis reveals a tight link between transcription factor dynamics and regulatory network architecture

Raja Jothi et al. Mol Syst Biol. 2009.

Abstract

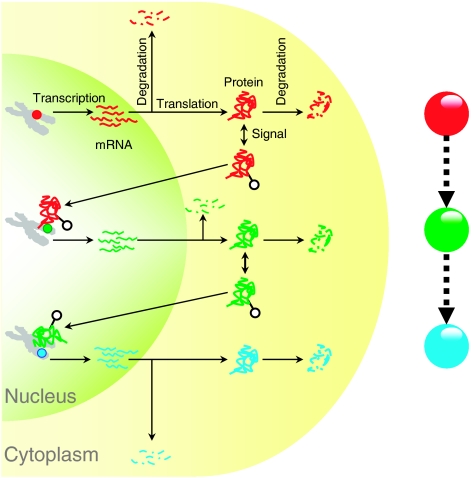
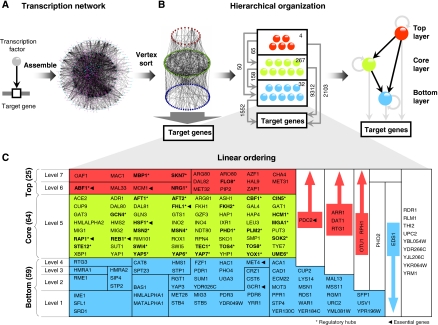
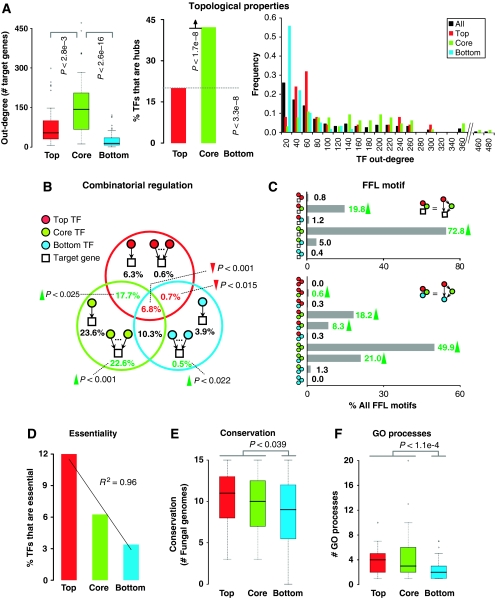
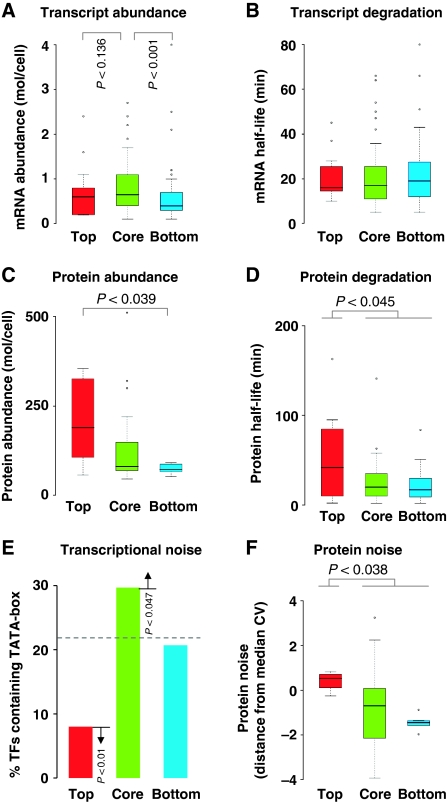
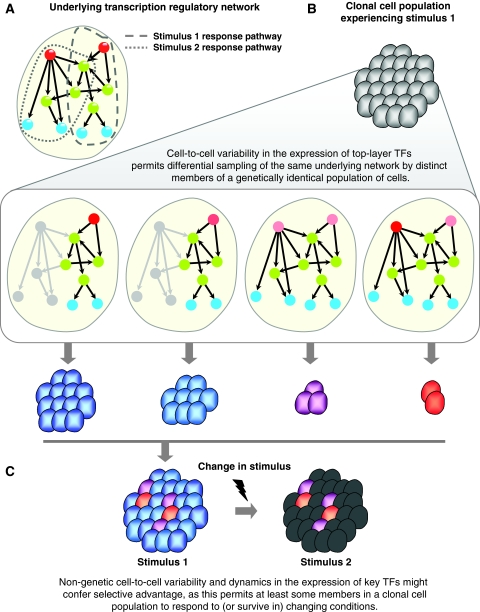
Although several studies have provided important insights into the general principles of biological networks, the link between network organization and the genome-scale dynamics of the underlying entities (genes, mRNAs, and proteins) and its role in systems behavior remain unclear. Here we show that transcription factor (TF) dynamics and regulatory network organization are tightly linked. By classifying TFs in the yeast regulatory network into three hierarchical layers (top, core, and bottom) and integrating diverse genome-scale datasets, we find that the TFs have static and dynamic properties that are similar within a layer and different across layers. At the protein level, the top-layer TFs are relatively abundant, long-lived, and noisy compared with the core- and bottom-layer TFs. Although variability in expression of top-layer TFs might confer a selective advantage, as this permits at least some members in a clonal cell population to initiate a response to changing conditions, tight regulation of the core- and bottom-layer TFs may minimize noise propagation and ensure fidelity in regulation. We propose that the interplay between network organization and TF dynamics could permit differential utilization of the same underlying network by distinct members of a clonal cell population.


Conflict of interest statement

The authors declare that they have no conflict of interest.

Figures

Figure 1
Figure 1
Network representation of a transcriptional regulatory cascade. Transcription factors (TFs), denoted as nodes in a network (red and green circles), represent several entities (gene, mRNA, and protein) and events (transcription, translation, degradation, etc) that are compressed in both space and time. Although a series of regulatory events can be conveniently represented as a node in the network, the dynamics of the entities and the biological processes that make up the node are not captured.
Figure 2
Figure 2
The vertex-sort algorithm—an approach to infer hierarchical structure in directed networks. Vertex sort first transforms the input network into one that is free of cycles by collapsing the strongly connected components (SCCs), if any, into super-nodes (orange and blue nodes). All edges within the SCC are represented with red arrows. Next, an iterative leaf-removal algorithm is applied on the resulting network and its transpose to obtain the linear ordering of nodes in the network. Super-nodes in the final ordering are represented by their constituent nodes (nodes 7 and 8 for the blue super-node and nodes 3–6 for the orange super-node). The directionality of the gray triangle represents the top-down or bottom-up ordering.
Figure 3
Figure 3
Hierarchical structure in the yeast transcription regulatory network. (A) Yeast regulatory network containing 13 385 regulatory interactions among 4503 genes, which includes 158 transcription factors (TFs) and 4369 target genes (TGs). (B) Vertex sort of TFs in the regulatory network reveals a hierarchical organizational structure (left panel). Middle panel depicts a schematic showing the inherent hierarchical structure with the number of regulatory interactions among TFs within and across layers, and those between TFs and TGs. The central skeleton of the hierarchy resembles a feed-forward structure spanning three basic non-overlapping layers, shown in red, green and blue (right panel). (C) Detailed hierarchical organization of yeast TFs. TFs within each block (polygon) can occupy any of the levels spanned by the block. Nine TFs in the right-most column are not a part of the hierarchy, as they are not connected to any other TF in the network. The hierarchal organization of TFs in the network naturally clusters into three basic non-overlapping layers: the top (red), core (green), and bottom (blue). Thirty-two regulatory hubs are highlighted in bold and marked with a star (*), and nine essential TFs are marked with an arrow.
Figure 4
Figure 4
Static properties of transcription factors (TFs) within the hierarchical framework. (A) Average number of target genes (TGs) regulated or co-regulated by TFs (left), percentage of TFs in each layer that are hubs (middle), and degree distribution of TFs (right). (B) Break-down of combinatorial regulatory patterns from a TG's perspective showing the percentage of TGs regulated by a combinatorial set of TFs from one or more layers. Less than 1% of TGs are jointly regulated by the top- and bottom-layer TFs. Values marked with red and green texts and arrows indicate that the corresponding subgroups are statistically under- or over-represented, respectively, compared with those in random networks of same size and degree distribution as the yeast regulatory network (see Results and Materials and methods). The percentages do not add up to 100, as a small fraction of genes are regulated by the ten unclassified TFs not included in the study. (C) Break-down of feed-forward loop (FFL) motifs showing the composition of all FFL motifs in the yeast regulatory network. Top panel shows FFL motifs where all the three nodes involve TFs, and the bottom panel shows FFL motifs involving two TFs and a TG. About 94% of all FFL motifs involve only the core- and/or top-layer TFs. Statistically over-represented FFL patterns are indicated by a green arrow, P<1.6 × 10⁻³. The percentages do not add up to 100, as a small fraction of genes are regulated by the ten unclassified TFs not included in the study. (D) Percentages of TFs that are essential in each of the three layers of the hierarchy. (E) Distribution of TF conservation levels (presence/absence of orthologs) across 15 fungal genomes in each of the three layers of the hierarchy. (F) Distribution of number of gene ontology (GO) biological processes a TF is associated with.
Figure 5
Figure 5
Dynamic properties of transcription factors (TFs) within the hierarchical framework. Distribution of TF values in each of the three layers of the inferred hierarchy for transcript abundance (mRNA molecules per cell) (A), transcript half-life (min) (B), protein abundance (protein molecules per cell) (C), protein half-life (min) (D), and noise in protein abundance (variability in protein levels in a cell population) (F). (E) Percentages of TFs in each of the three hierarchical layers containing a TATA-box. The expected percentage is shown as a broken line (22%). The y axis in (F) denotes protein noise measured as the distance from median co-efficient of variation of all proteins (DM; see Materials and methods).
Figure 6
Figure 6
A schematic model describing the conceptual framework of differential utilization of the same underlying regulatory network by distinct members of a genetically identical cell population. (A) A toy regulatory network showing two regulatory pathways, which will be used to respond to two specific extracellular stimuli. The red, green, and blue nodes in the network represent transcription factors (TFs), symbolically representing the inferred top-, core-, and bottom-layer TFs in the hierarchical network, respectively. (B) Members of a clonal cell population responding to stimulus 1 (top panel). The variability in expression of top-layer TFs (shown as nodes in varying shades of red; middle panel) permits differential sampling of the same underlying network by distinct members of a genetically identical population of cells. TFs colored in gray are not expressed at necessary levels, and are shown as inactive nodes. Edges originating from inactive TFs are inactive (shown in gray). A noisy master-regulator TF at the top of the hierarchy would mean that only a subset of a population, in which this TF is expressed at necessary levels, will have this TF in active form. An inactive TF at the top of a hierarchical regulatory cascade will result in the non-expression per inactivation of all downstream TFs and TGs dependent on this TF. Members of a clonal population whose regulatory pathway for a specific extracellular stimulus is active will initiate an effective response when that stimulus is encountered. And, those members in whom this regulatory pathway is inactive will be unable to mount an effective response. Though all members in the population are sampling the part of the network necessary to respond to stimulus 1, only a few members (shown as purple and orange cells; bottom panel) are sampling (or poised to sample) the part of the network necessary to respond to stimulus 2. (C) A change in stimulus (from stimulus 1 to 2) causes only those cells that have an active regulatory response pathway for stimulus 2 to effectively respond and survive, whereas the others may mount a late response or will not survive. Alternatively, low expression of top-layer TFs might facilitate cell survival if the pathway regulated by such TFs leads to cell death (e.g., apoptosis). Thus, the presence of noisy TFs at the top of the hierarchical regulatory cascade might confer a selective advantage as this permits at least some members in a clonal population to respond to changing conditions.

Similar articles

Cited by

References

    1. Acar M, Mettetal JT, van Oudenaarden A (2008) Stochastic switching as a survival strategy in fluctuating environments. Nat Genet 40: 471–475 - PubMed
    1. Alon U (2007) Network motifs: theory and experimental approaches. Nat Rev Genet 8: 450–461 - PubMed
    1. Arias AM, Hayward P (2006) Filtering transcriptional noise during development: concepts and mechanisms. Nat Rev Genet 7: 34–44 - PubMed
    1. Babu MM, Luscombe NM, Aravind L, Gerstein M, Teichmann SA (2004) Structure and evolution of transcriptional regulatory networks. Curr Opin Struct Biol 14: 283–291 - PubMed
    1. Balaban NQ, Merrin J, Chait R, Kowalik L, Leibler S (2004) Bacterial persistence as a phenotypic switch. Science 305: 1622–1625 - PubMed

Publication types

Substances

LinkOut - more resources