

Interleukin-10 prevents diet-induced insulin resistance by attenuating macrophage and cytokine response in skeletal muscle
- PMID: 19690064
- PMCID: PMC2768157
- DOI: 10.2337/db08-1261
Interleukin-10 prevents diet-induced insulin resistance by attenuating macrophage and cytokine response in skeletal muscle
Abstract
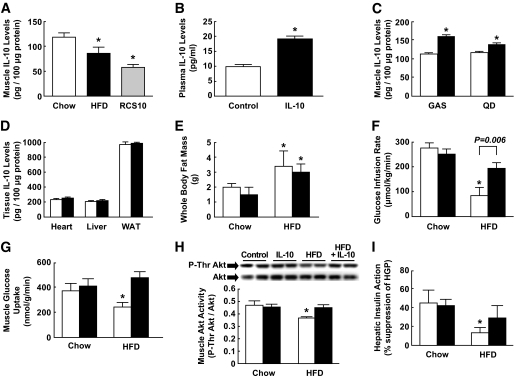
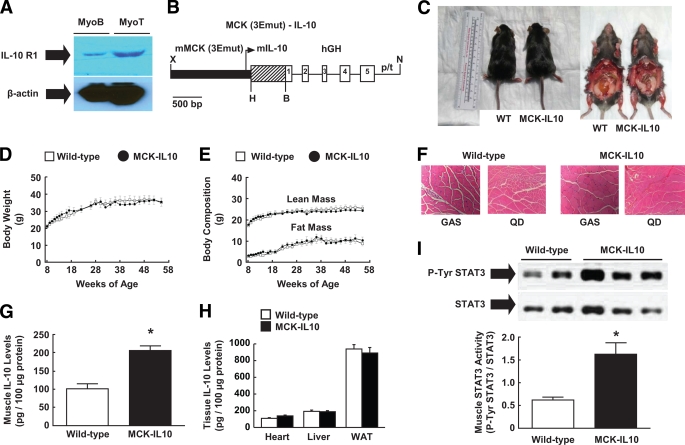
Objective: Insulin resistance is a major characteristic of type 2 diabetes and is causally associated with obesity. Inflammation plays an important role in obesity-associated insulin resistance, but the underlying mechanism remains unclear. Interleukin (IL)-10 is an anti-inflammatory cytokine with lower circulating levels in obese subjects, and acute treatment with IL-10 prevents lipid-induced insulin resistance. We examined the role of IL-10 in glucose homeostasis using transgenic mice with muscle-specific overexpression of IL-10 (MCK-IL10).
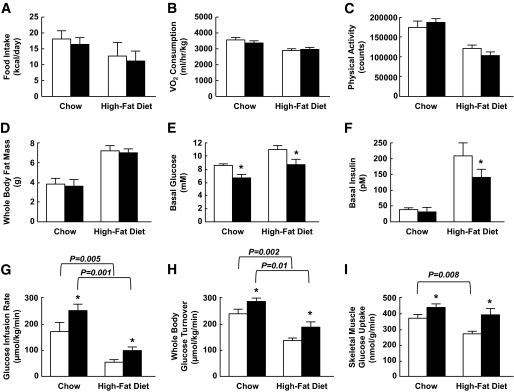
Research design and methods: MCK-IL10 and wild-type mice were fed a high-fat diet (HFD) for 3 weeks, and insulin sensitivity was determined using hyperinsulinemic-euglycemic clamps in conscious mice. Biochemical and molecular analyses were performed in muscle to assess glucose metabolism, insulin signaling, and inflammatory responses.
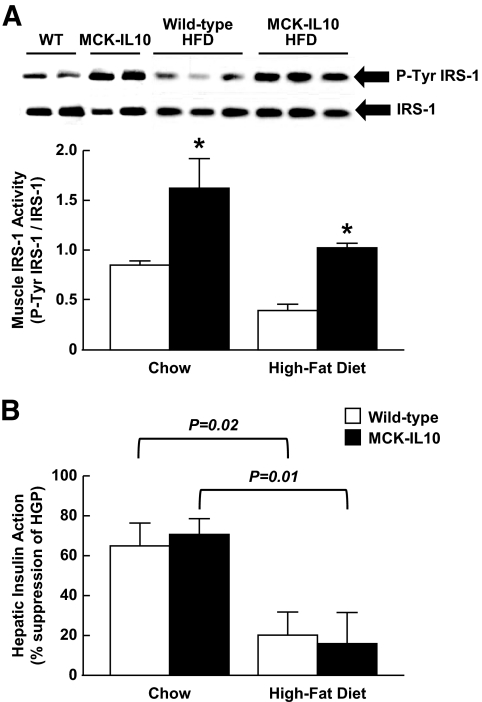
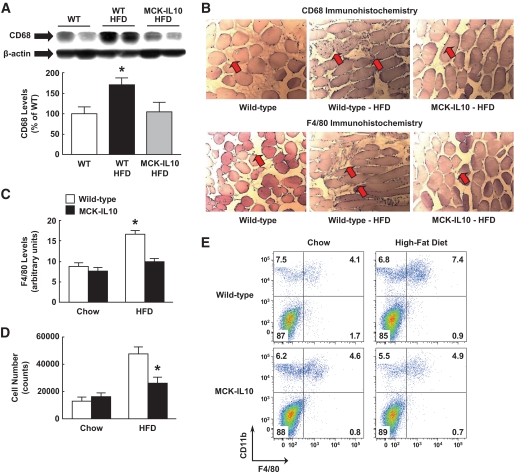
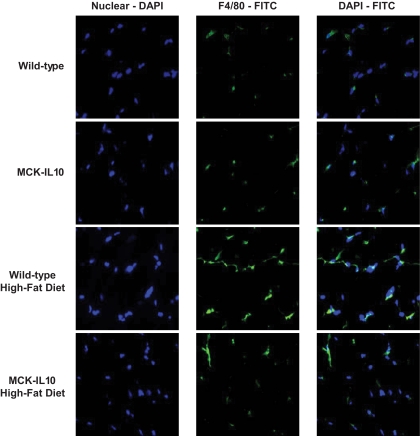
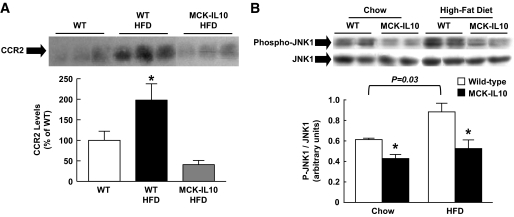
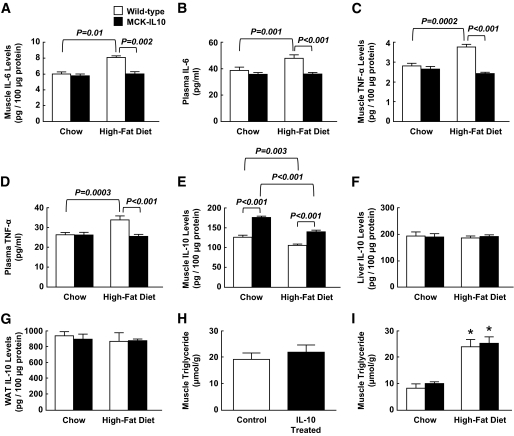
Results: MCK-IL10 mice developed with no obvious anomaly and showed increased whole-body insulin sensitivity. After 3 weeks of HFD, MCK-IL10 mice developed comparable obesity to wild-type littermates but remained insulin sensitive in skeletal muscle. This was mostly due to significant increases in glucose metabolism, insulin receptor substrate-1, and Akt activity in muscle. HFD increased macrophage-specific CD68 and F4/80 levels in wild-type muscle that was associated with marked increases in tumor necrosis factor-alpha, IL-6, and C-C motif chemokine receptor-2 levels. In contrast, MCK-IL10 mice were protected from diet-induced inflammatory response in muscle.
Conclusions: These results demonstrate that IL-10 increases insulin sensitivity and protects skeletal muscle from obesity-associated macrophage infiltration, increases in inflammatory cytokines, and their deleterious effects on insulin signaling and glucose metabolism. Our findings provide novel insights into the role of anti-inflammatory cytokine in the treatment of type 2 diabetes.
Figures
Similar articles
-
Altered Interleukin-10 Signaling in Skeletal Muscle Regulates Obesity-Mediated Inflammation and Insulin Resistance.Mol Cell Biol. 2016 Nov 14;36(23):2956-2966. doi: 10.1128/MCB.00181-16. Print 2016 Dec 1. Mol Cell Biol. 2016. PMID: 27644327 Free PMC article.
-
Differential effects of interleukin-6 and -10 on skeletal muscle and liver insulin action in vivo.Diabetes. 2004 Apr;53(4):1060-7. doi: 10.2337/diabetes.53.4.1060. Diabetes. 2004. PMID: 15047622
-
IL-10 prevents aging-associated inflammation and insulin resistance in skeletal muscle.FASEB J. 2017 Feb;31(2):701-710. doi: 10.1096/fj.201600832R. Epub 2016 Nov 3. FASEB J. 2017. PMID: 27811060 Free PMC article.
-
Recent advances in the relationship between obesity, inflammation, and insulin resistance.Eur Cytokine Netw. 2006 Mar;17(1):4-12. Eur Cytokine Netw. 2006. PMID: 16613757 Review.
-
Skeletal muscle insulin resistance is the primary defect in type 2 diabetes.Diabetes Care. 2009 Nov;32 Suppl 2(Suppl 2):S157-63. doi: 10.2337/dc09-S302. Diabetes Care. 2009. PMID: 19875544 Free PMC article. Review. No abstract available.
Cited by
-
GIPR Signaling in Immune Cells Maintains Metabolically Beneficial Type 2 Immune Responses in the White Fat From Obese Mice.Front Immunol. 2021 Feb 25;12:643144. doi: 10.3389/fimmu.2021.643144. eCollection 2021. Front Immunol. 2021. PMID: 33717200 Free PMC article.
-
Insulin signalling mechanisms for triacylglycerol storage.Diabetologia. 2013 May;56(5):949-64. doi: 10.1007/s00125-013-2869-1. Epub 2013 Feb 27. Diabetologia. 2013. PMID: 23443243 Free PMC article. Review.
-
Sex and obesity influence the relationship between perfluoroalkyl substances and lean body mass: NHANES 2011-2018.Heliyon. 2024 Aug 8;10(17):e35888. doi: 10.1016/j.heliyon.2024.e35888. eCollection 2024 Sep 15. Heliyon. 2024. PMID: 39319151 Free PMC article.
-
High-fat load: mechanism(s) of insulin resistance in skeletal muscle.Int J Obes Suppl. 2012 Dec;2(Suppl 2):S31-S36. doi: 10.1038/ijosup.2012.20. Int J Obes Suppl. 2012. PMID: 26052434 Free PMC article.
-
Increased metabolic rate and insulin sensitivity in male mice lacking the carcino-embryonic antigen-related cell adhesion molecule 2.Diabetologia. 2012 Mar;55(3):763-72. doi: 10.1007/s00125-011-2388-x. Epub 2011 Dec 11. Diabetologia. 2012. PMID: 22159884 Free PMC article.
References
-
- Wild S, Roglic G, Green A, Sicree R, King H: Global prevalence of diabetes: estimates for the year 2000 and projections for 2030. Diabetes Care 2004;27:1047–1053 - PubMed
-
- Kahn CR: Insulin action, diabetogenes, and the cause of type II diabetes. Diabetes 1994;43:1066–1084 - PubMed
-
- Goldberg IJ: Diabetic dyslipidemia: causes and consequences. J Clin Endo Metab 2001;86:965–971 - PubMed
-
- Reaven GM: Role of insulin resistance in human disease. Diabetes 1988;37:1595–1607 - PubMed
-
- Boden G: Obesity, free fatty acids, and insulin resistance. Curr Opin Endo Diabetes 2001;8:235–239
Publication types
MeSH terms
Substances
Grants and funding
LinkOut - more resources
Full Text Sources
Other Literature Sources
Medical
Molecular Biology Databases
