RNA gain-of-function in spinocerebellar ataxia type 8
- PMID: 19680539
- PMCID: PMC2719092
- DOI: 10.1371/journal.pgen.1000600
RNA gain-of-function in spinocerebellar ataxia type 8
Abstract
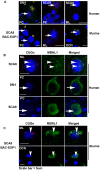
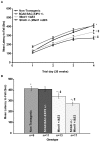
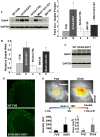
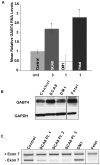
Microsatellite expansions cause a number of dominantly-inherited neurological diseases. Expansions in coding-regions cause protein gain-of-function effects, while non-coding expansions produce toxic RNAs that alter RNA splicing activities of MBNL and CELF proteins. Bi-directional expression of the spinocerebellar ataxia type 8 (SCA8) CTG CAG expansion produces CUG expansion RNAs (CUG(exp)) from the ATXN8OS gene and a nearly pure polyglutamine expansion protein encoded by ATXN8 CAG(exp) transcripts expressed in the opposite direction. Here, we present three lines of evidence that RNA gain-of-function plays a significant role in SCA8: 1) CUG(exp) transcripts accumulate as ribonuclear inclusions that co-localize with MBNL1 in selected neurons in the brain; 2) loss of Mbnl1 enhances motor deficits in SCA8 mice; 3) SCA8 CUG(exp) transcripts trigger splicing changes and increased expression of the CUGBP1-MBNL1 regulated CNS target, GABA-A transporter 4 (GAT4/Gabt4). In vivo optical imaging studies in SCA8 mice confirm that Gabt4 upregulation is associated with the predicted loss of GABAergic inhibition within the granular cell layer. These data demonstrate that CUG(exp) transcripts dysregulate MBNL/CELF regulated pathways in the brain and provide mechanistic insight into the CNS effects of other CUG(exp) disorders. Moreover, our demonstration that relatively short CUG(exp) transcripts cause RNA gain-of-function effects and the growing number of antisense transcripts recently reported in mammalian genomes suggest unrecognized toxic RNAs contribute to the pathophysiology of polyglutamine CAG CTG disorders.
Conflict of interest statement
The authors have declared that no competing interests exist.
Figures

Comment in
-
SCA8 CAG/CTG expansions, a tale of two TOXICities: a unique or common case?PLoS Genet. 2009 Aug;5(8):e1000593. doi: 10.1371/journal.pgen.1000593. Epub 2009 Aug 14. PLoS Genet. 2009. PMID: 19680445 Free PMC article. No abstract available.
Similar articles
-
Bidirectional expression of the SCA8 expansion mutation: one mutation, two genes.Cerebellum. 2008;7(2):150-8. doi: 10.1007/s12311-008-0010-7. Cerebellum. 2008. PMID: 18418692
-
Bidirectional expression of CUG and CAG expansion transcripts and intranuclear polyglutamine inclusions in spinocerebellar ataxia type 8.Nat Genet. 2006 Jul;38(7):758-69. doi: 10.1038/ng1827. Epub 2006 Jun 25. Nat Genet. 2006. PMID: 16804541
-
Spinocerebellar ataxia type 8 larger triplet expansion alters histone modification and induces RNA foci.BMC Mol Biol. 2009 Feb 10;10:9. doi: 10.1186/1471-2199-10-9. BMC Mol Biol. 2009. PMID: 19203395 Free PMC article.
-
Molecular genetics of spinocerebellar ataxia type 8 (SCA8).RNA Biol. 2005 Apr;2(2):49-52. doi: 10.4161/rna.2.2.1682. Epub 2005 Apr 25. RNA Biol. 2005. PMID: 17132942 Review.
-
Molecular genetics of spinocerebellar ataxia type 8 (SCA8).Cytogenet Genome Res. 2003;100(1-4):175-83. doi: 10.1159/000072852. Cytogenet Genome Res. 2003. PMID: 14526178 Review.
Cited by
-
Long non-coding RNAs: versatile master regulators of gene expression and crucial players in cancer.Am J Transl Res. 2012;4(2):127-50. Epub 2012 Apr 8. Am J Transl Res. 2012. PMID: 22611467 Free PMC article.
-
Regulatory mechanisms of long noncoding RNAs in vertebrate central nervous system development and function.Neuroscience. 2013 Apr 3;235:200-14. doi: 10.1016/j.neuroscience.2013.01.022. Epub 2013 Jan 18. Neuroscience. 2013. PMID: 23337534 Free PMC article. Review.
-
Role of noncoding RNAs in trinucleotide repeat neurodegenerative disorders.Exp Neurol. 2012 Jun;235(2):469-75. doi: 10.1016/j.expneurol.2012.01.019. Epub 2012 Jan 27. Exp Neurol. 2012. PMID: 22309832 Free PMC article. Review.
-
Inactivation of hnRNP K by expanded intronic AUUCU repeat induces apoptosis via translocation of PKCdelta to mitochondria in spinocerebellar ataxia 10.PLoS Genet. 2010 Jun 10;6(6):e1000984. doi: 10.1371/journal.pgen.1000984. PLoS Genet. 2010. PMID: 20548952 Free PMC article.
-
Targeting noncoding RNAs in disease.J Clin Invest. 2017 Mar 1;127(3):761-771. doi: 10.1172/JCI84424. Epub 2017 Mar 1. J Clin Invest. 2017. PMID: 28248199 Free PMC article. Review.
References
-
- Day JW, Schut LJ, Moseley ML, Durand AC, Ranum LPW. Spinocerebellar ataxia type 8: clinical features in a large family. Neurology. 2000;55:649–657. - PubMed
-
- Koob MD, Moseley ML, Schut LJ, Benzow KA, Bird TD, et al. An untranslated CTG expansion causes a novel form of spinocerebellar ataxia (SCA8). Nat Genet. 1999;21:379–384. - PubMed
-
- Moseley ML, Zu T, Ikeda Y, Gao W, Mosemiller AK, et al. Bidirectional expression of CUG and CAG expansion transcripts and intranuclear polyglutamine inclusions in spinocerebellar ataxia type 8. Nat Genet. 2006;38:758–769. - PubMed
-
- Ranum LPW, Cooper TA. RNA-mediated neuromuscular disorders. Annu Rev Neurosci. 2006;29:259–277. - PubMed
Publication types
MeSH terms
Substances
Grants and funding
LinkOut - more resources
Full Text Sources
Other Literature Sources
Molecular Biology Databases

