. 2009 Oct;37(18):6028-41.
doi: 10.1093/nar/gkp605. Epub 2009 Aug 11.

Ionizing radiation-dependent and independent phosphorylation of the 32-kDa subunit of replication protein A during mitosis

Affiliations

Ionizing radiation-dependent and independent phosphorylation of the 32-kDa subunit of replication protein A during mitosis

Holger Stephan et al. Nucleic Acids Res. 2009 Oct.

Abstract

The human single-stranded DNA-binding protein, replication protein A (RPA), is regulated by the N-terminal phosphorylation of its 32-kDa subunit, RPA2. RPA2 is hyperphosphorylated in response to various DNA-damaging agents and also phosphorylated in a cell-cycle-dependent manner during S- and M-phase, primarily at two CDK consensus sites, S23 and S29. Here we generated two monoclonal phospho-specific antibodies directed against these CDK sites. These phospho-specific RPA2-(P)-S23 and RPA2-(P)-S29 antibodies recognized mitotically phosphorylated RPA2 with high specificity. In addition, the RPA2-(P)-S23 antibody recognized the S-phase-specific phosphorylation of RPA2, suggesting that during S-phase only S23 is phosphorylated, whereas during M-phase both CDK sites, S23 and S29, are phosphorylated. Immunofluorescence microscopy revealed that the mitotic phosphorylation of RPA2 starts at the onset of mitosis, and dephosphorylation occurs during late cytokinesis. In mitotic cells treated with ionizing radiation (IR), we observed a rapid hyperphosphorylation of RPA2 in addition to its mitotic phosphorylation at S23 and S29, associated with a significant change in the subcellular localization of RPA. Our data also indicate that the RPA2 hyperphosphorylation in response to IR is facilitated by the activity of both ATM and DNA-PK, and is associated with activation of the Chk2 pathway.


Figures
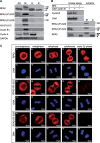
Figure 1.
Figure 1.
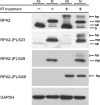
Characterization of phospho-specific antibodies anti-RPA2-(P)-S23 and anti-RPA2-(P)-S29. (A) Immunoblots showing the reactivity of phospho-specific anti-RPA2-(P)-S23 and anti-RPA2-(P)-S29 antibodies to RPA2 in asynchronous (AS), mitotically (M), and S-phase (S) arrested cells. In addition, 100 ng of purified human recombinant RPA (R) and the reactivities of anti-RPA2 (total, RBF-4E4) antibody served as controls. Detection of phospho-specific H3-(P)-S10, cyclin B1 and cyclin A by the appropriate antibodies were used as cell-cycle markers. Detection of GAPDH in different extracts served as a loading control. Abbreviation used in the figure: hp = hyperphosphorylated RPA2, mp = mitotically phosphorylated RPA2, sp = phosphorylated at a single CDK-site of RPA2, b = basal RPA2 (no mobility shift). (B) Reactivity of phospho-specific anti-RPA2-(P)-S23, anti-RPA2-(P)-S29, and total anti-RPA2 antibodies to in vitro phosphorylated RPA2 by Cdk1-cyclin B. Totally 100 ng of purified, recombinant RPA2 was phosphorylated by 2 µg purified Cdk1-cyclin B. Then in vitro phosphorylated RPA2 and cell extracts obtained from cells arrested in M- and S-phase were analyzed by western blot. The membrane was probed with phospho-specific anti-RPA2-(P)-S29 and horseradish peroxidase coupled secondary antibody and reactivity was detected with ECL. Then the membrane was stripped with Restore Western Blot Stripping Buffer (Pierce) and incubated a second time with anti-RPA2-(P)-S23 antibody to detect RPA2 phosphorylation at S23. After stripping the membrane a second time, it was analyzed with total RPA2 antibody RBF-E4E to detect all forms of RPA2. Detection of Cdk1 and cyclin B with specific antibodies served as controls for active kinase. Phosphorylated RPA2 bands in S-phase cell extracts of the immunoblot were quantified using Image Gauge software (Raytest, Germany) yielding five arbitrary units (AU) of RPA2 sp form in comparison to 51 AU of b form with the anti-RPA2 antibody (total, RBF-4E4). Additionally the antibodies RBF-4E4 and anti-RPA2-(P)-S23 recognized biochemically phosphorylated and in vivo phosphorylated RPA2 (sp forms) with similar sensitivity (RBF-4E4: 28 AU and 5 AU, anti-RPA2-(P)-S23: 25 AU and 3.5 AU). (C) Immunolocalization of total and mitotically phosphorylated RPA2 at different stages of M-phase. RPA2 was detected using anti-RPA2-(P)-S23, anti-RPA2-(P)-S29 and total anti-RPA2 [RBF-4E4] primary antibodies and Cy3-labeled secondary antibodies and analyzed by confocal microscopy. DNA was counterstained with ToPro3.
Figure 2.
Figure 2.
RPA2 is hyperphosphorylated in response to IR in mitosis. Immunoblots showing RPA2 hyperphosphorylation in response to IR as detected by phospho-specific RPA2-(P)-S23 and anti-RPA2-(P)-S29 antibodies. Asynchronous (AS) and mitotically arrested (M) HeL-S3 cells were mock- or IR treated (10 Gy) and analyzed 1-h post-treatment. Total anti-RPA2 and anti-RPA2-(P)-S4/8 antibodies were employed as control. Recognition of GAPDH served as a loading control. Abbreviations used in the figure: hp = hyperphosphorylated RPA2, mp = mitotically phosphorylated RPA2, sp = RPA2 phosphorylated at a single CDK site, b = basal RPA2 (no mobility shift).
Figure 3.
Figure 3.
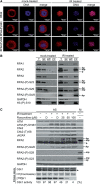
RPA2 co-localizes with chromosomal DNA in response to IR in mitotic HeLa S3 cells. (A) Images showing changes in the localization pattern of RPA2 in mitotic HeLa S3 cells, which were mock- or IR treated (10 Gy) and fixed 1-h post-irradiation. RPA2 was detected using a total anti-RPA2 [RBF-4E4], phospho-specific anti-RPA2-(P)-S23 and anti-RPA2-(P)-S29 antibodies. The DNA was counterstained with ToPro-3. (B) Immunoblot showing subcellular fractionation of mitotic cells mock treated or exposed to IR (10 Gy). Subcellular localization of RPA subunits was detected using RPA antibodies as indicated. Anti-H3-(P)-S10 and anti-GAPDH antibodies were used as controls. Abbreviations used in the figure: T = whole cell lysates, SF = soluble fraction, WF = wash fraction and CF = chromosomal bound fraction. (C) RPA2 hyperphosphorylation in response to IR treatment in asynchronous cells. Immunoblot showing RPA2 hyperphosphorylation response of asynchronous HeLa S3 cells in the presence or absence of CDK inhibitor roscovitine after IR treatment. Asynchronous HeLa S3 cells were preincubated for 30 min with 25, 50 and 100 µM of roscovitine or DMSO as solvent control, followed by mock- or IR treatment (10 Gy) and 1-h incubation in the continued presence or absence of roscovitine or in the presence of DMSO as solvent control. Cells were harvested and analyzed by immunoblot using an total RPA2, phosphopecific RPA2-(P)-S4/S8, phosphopecific RPA2-(P)-S23 or phosphopecific RPA2-(P)-S29 antibodies. The activation of the ATM-Chk2 checkpoint pathway was monitored using phosphopecific antibodies ATM-(P)-S1981 and Chk2-(P)-T68. The anti-γH2X antibody was employed as marker for DSBs. Anti-ATM, anti-Chk2 and anti-GAPDH antibody served as loading controls. Abbreviations used in the figure: AS = asynchronous cells, M = mitotic cells, D = DMSO solvent only, hp = hyperphosphorylated RPA2, mp = mitotically phosphorylated RPA2, b = basal RPA2 (no mobility shift). To verify the Cdk1 inhibition by roscovitine, Cdk1 was immunoprecipitated, and its kinase activity was measured using a histone H1 kinase assays. After SDS–PAGE, the gel was stained with Coomassie blue and incorporation of [32P] phosphate into histone H1 was analyzed using a phosphor imager system (Fuji LA 5000, Fuji Europe, Germany) and quantification with ImageGauge software (Fuji Europe, Germany). The Cdk1 activity of the mock-treated sample in absence of roscovitine was arbitrarily defined as 100% Cdk1 activity. The Coomassie blue stain of the gel and the immunoblot with anti-Cdk1 antibody demonstrate that equal amount of H1 and Cdk1, respectively, were present in these reactions (asterisk marks the antibody light chain).
Figure 4.
Figure 4.
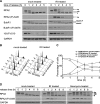
IR treatment of human cells in mitosis leads to delay in mitotic progression and RPA2 hyperphosphorylation. (A) Immunoblot showing RPA2 phosphorylation patterns in response to IR treatment in mitosis. Mitotic HeLa S3 cells were obtained by nocodazole arrest for 16 h followed by mitotic shake off. Cells were mock- or IR treated (10 Gy) and subsequently released from the arrest. Cells were harvested at the indicated time points. Whole cell lysates were analyzed by immunoblot as indicated. The proteins detected by the phospho-specific anti-H3-(P)-S10 antibody and the anti-GAPDH antibody served as mitosis marker and loading control, respectively. (B) Flow cytometry profiles showing analysis of the cell-cycle progression in HeLa S3 cells after release from nocodazole arrest and mock or IR treatment (10 Gy). Representative flow cytometry profile of mock- or IR treated (10 Gy) HeLa S3 cells over time following nocodazole release. (C) Diagram showing the quantified average (n = 3) of flow cytometry results present in Figure 4B. Cells in G2/M- and G1-phase are represented as percentage of the total cell population. Results are expressed as mean ± S.D. and differences between mock- and IR treated cell populations were significant according to a Student's t-test (P ≤ 0.01). (D) Immunoblot showing RPA2 hyperphosphorylation in response to IR or bleomycin treatment in mitosis. Mitotically arrested HeLa S3 cells were either mock-treated, exposed to IR (10 Gy) or incubated for 1 h with bleomycin (1 μg/ml) and released from the arrest into fresh medium lacking any agents. Cells were harvested at the indicated time points and whole cell lysates were analyzed by immunoblot as indicated. Abbreviations used in the figure: hp–hyperphosphorylated RPA2, mp–mitotically phosphorylated RPA2, b–basal RPA2 (no mobility shift), BubR1-P–phosphorylated BubR1, BubR1–unphosphorylated BubR1.
Figure 5.
Figure 5.
IR treatment of cells in mitosis yields a different checkpoint response in nocodazole-arrested and cells released from nocodazole block. Mitotic HeLa S3 cells were mock- or IR treated (10 Gy) and released from the mitotic arrest or kept in mitotic arrest. Cells were harvested at indicated time points. (A) Immunoblot showing RPA2 as detected by total anti-RPA2, phospho-specific anti-RPA2-(P)-S4/8, anti-RPA2-(P)-S23 and anti-RPA2-(P)-S29 antibodies. (B) Immunoblot showing the checkpoint activation in mitotic cells in response to IR as detected with phospho-specific Chk1-(P)-S317 and Chk2-(P)-T68 antibodies. Antibodies against total Chk1, Chk2 and anti-GAPDH served as loading controls. Abbreviations used in the figure: hp = hyperphosphorylated RPA2, mp = mitotically phosphorylated RPA2, b = basal RPA2 (no mobility shift).
Figure 6.
Figure 6.
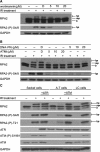
Involvement of ATM and DNA-PK in hyperphosphorylation of RPA2 after IR treatment of mitotic cells. (A) Immunoblot showing RPA2 hyperphosphorylation response of mitotic HeLa S3 cells in the presence of PIKK inhibitor wortmannin. Mitotically arrested HeLa S3 cells were incubated for 1 h with 5, 10 and 20 µM of wortmannin or DMSO as solvent control prior to mock or IR treatment. At 1-h post-irradiation cells were harvested and analyzed by immunoblot using an total RPA2 or phosphopecific RPA2-(P)-S4/S8 antibodies. Anti-GAPDH antibody served as loading control. (B) Immunoblot showing the RPA2 hyperphosphorylation response to IR treatment in mitosis in the presence of specific ATM or DNA-PK inhibitors. Mitotically arrested HeLa S3 cells were incubated for 1 h with 5, 10 and 20 µM of ATM-inhibitor (ATMi) KU-55933, DNA-PK-inhibitor (DNA-PKi) NU7441 or DMSO as solvent control alone. Following this treatment, cells were mock- or IR treated (10 Gy). At 1 h post-irradiation cells were analyzed by immunoblot using a total RPA2 or phosphopecific RPA2-(P)-S4/S8 antibodies. Anti-GAPDH antibody served as loading control. (C) Immunoblot showing RPA2 hyperphosphorylation response of mitotic Seckel, A-T and control (LC) cells after IR treatment. Seckel, A-T and LC cells were enriched in mitosis using two consecutive cell-cycle arrests (thymidine followed by nocodazole block), followed by mock or IR treatment (10 Gy). Cell extracts were prepared 1-h post-irradiation. RPA2 was analyzed by immunoblot using the indicated antibodies. The expression levels of ATM and ATR were detected with anti-ATM and anti-ATR antibodies. A phospho-specific anti-ATM-(P)-S1981 antibody was employed to monitor DNA damage-dependent phoshorylation of ATM. Seckel and A-T cell lines stably transfected with full length ATR (labeled as ‘+ATR’) or ATM (labeled ‘+ATM’) cDNA expression vectors were established, respectively. An anti-GAPDH antibody was used as loading control. Abbreviations used in the figure: D = DMSO solvent only, hp = hyperphosphorylated RPA2, mp = mitotically phosphorylated RPA2, b = basal RPA2 (no mobility shift).

Similar articles

Cited by

References

    1. Sancar A, Lindsey-Boltz LA, Unsal-Kacmaz K, Linn S. Molecular mechanisms of mammalian DNA repair and the DNA damage checkpoints. Annu. Rev. Biochem. 2004;73:39–85. - PubMed
    1. Giaccia AJ, Kastan MB. The complexity of p53 modulation: emerging patterns from divergent signals. Genes Dev. 1998;12:2973–2983. - PubMed
    1. Nasheuer HP, Smith R, Bauerschmidt C, Grosse F, Weisshart K. Initiation of eukaryotic DNA replication: regulation and mechanisms. Prog. Nucleic Acid Res. Mol. Biol. 2002;72:41–94. - PubMed
    1. Sakasai R, Shinohe K, Ichijima Y, Okita N, Shibata A, Asahina K, Teraoka H. Differential involvement of phosphatidylinositol 3-kinase-related protein kinases in hyperphosphorylation of replication protein A2 in response to replication-mediated DNA double-strand breaks. Genes Cells. 2006;11:237–246. - PubMed
    1. Wold MS. Replication protein A: a heterotrimeric, single-stranded DNA-binding protein required for eukaryotic DNA metabolism. Annu. Rev. Biochem. 1997;66:61–92. - PubMed

Publication types

MeSH terms