

Gene expression signatures diagnose influenza and other symptomatic respiratory viral infections in humans
- PMID: 19664979
- PMCID: PMC2852511
- DOI: 10.1016/j.chom.2009.07.006
Gene expression signatures diagnose influenza and other symptomatic respiratory viral infections in humans
Abstract
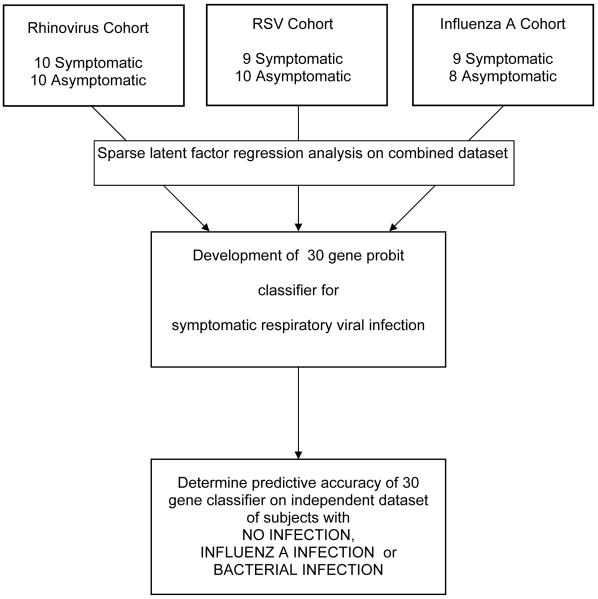
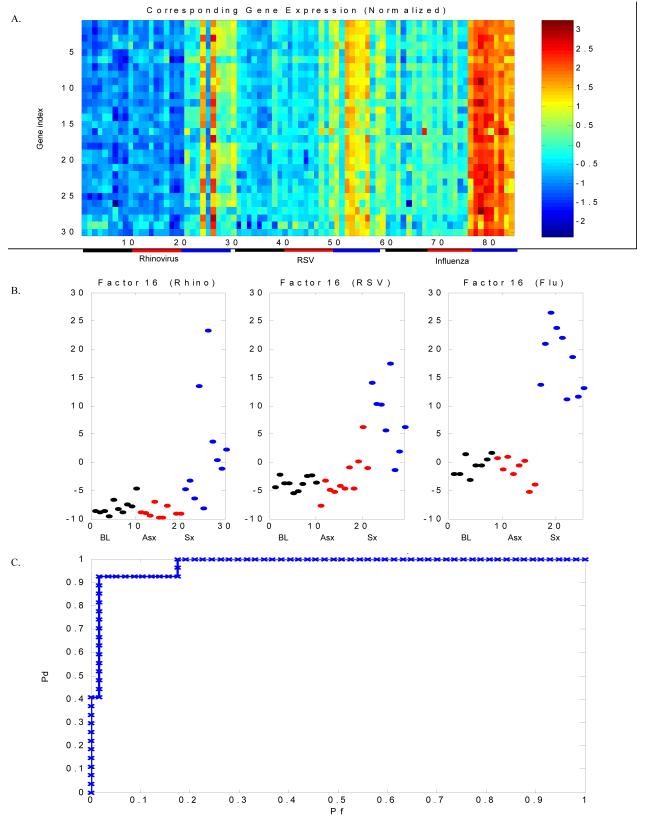
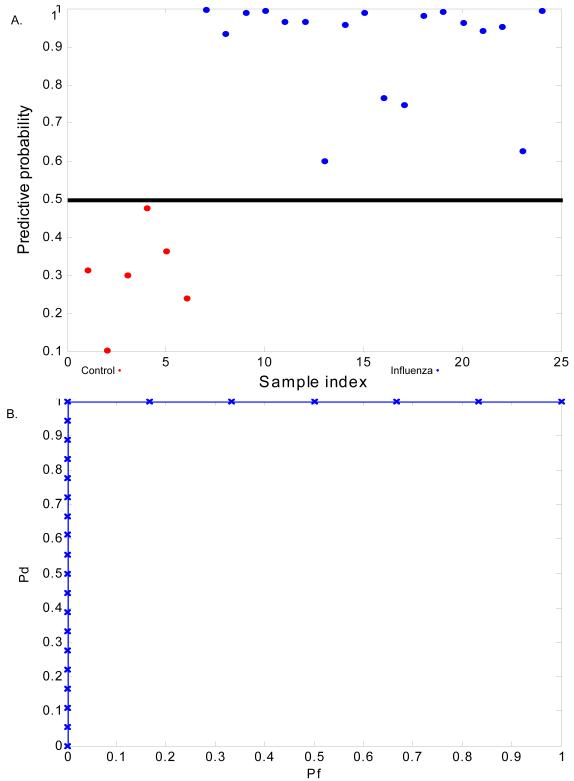
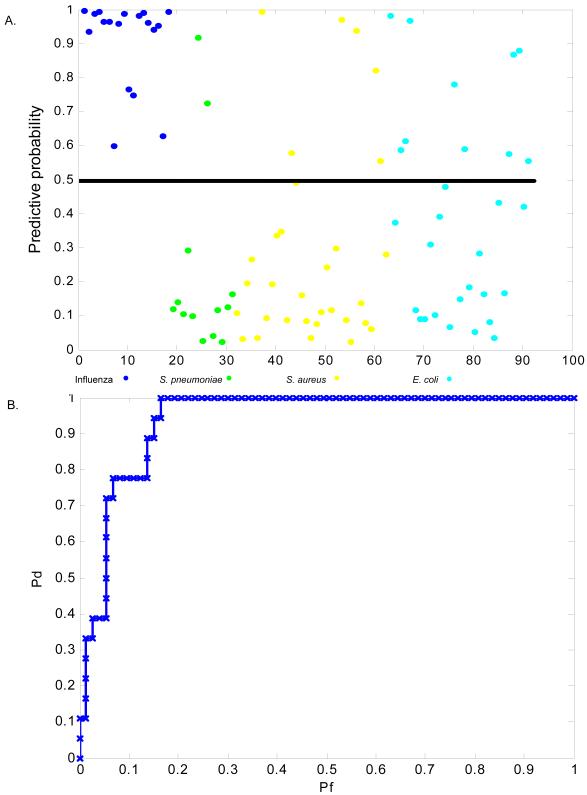
Acute respiratory infections (ARIs) are a common reason for seeking medical attention, and the threat of pandemic influenza will likely add to these numbers. Using human viral challenge studies with live rhinovirus, respiratory syncytial virus, and influenza A, we developed peripheral blood gene expression signatures that distinguish individuals with symptomatic ARIs from uninfected individuals with >95% accuracy. We validated this "acute respiratory viral" signature-encompassing genes with a known role in host defense against viral infections-across each viral challenge. We also validated the signature in an independently acquired data set for influenza A and classified infected individuals from healthy controls with 100% accuracy. In the same data set, we could also distinguish viral from bacterial ARIs (93% accuracy). These results demonstrate that ARIs induce changes in human peripheral blood gene expression that can be used to diagnose a viral etiology of respiratory infection and triage symptomatic individuals.
Figures
Comment in
-
Shifting the paradigm: host gene signatures for diagnosis of infectious diseases.Cell Host Microbe. 2009 Sep 17;6(3):199-200. doi: 10.1016/j.chom.2009.08.007. Cell Host Microbe. 2009. PMID: 19748461
-
Improving development of the molecular signature for diagnosis of acute respiratory viral infections.Cell Host Microbe. 2010 Feb 18;7(2):100-1; author reply 102. doi: 10.1016/j.chom.2010.01.003. Cell Host Microbe. 2010. PMID: 20159615 Free PMC article. No abstract available.
Similar articles
-
Integrated, Multi-cohort Analysis Identifies Conserved Transcriptional Signatures across Multiple Respiratory Viruses.Immunity. 2015 Dec 15;43(6):1199-211. doi: 10.1016/j.immuni.2015.11.003. Immunity. 2015. PMID: 26682989 Free PMC article.
-
A host-based RT-PCR gene expression signature to identify acute respiratory viral infection.Sci Transl Med. 2013 Sep 18;5(203):203ra126. doi: 10.1126/scitranslmed.3006280. Sci Transl Med. 2013. PMID: 24048524 Free PMC article.
-
Development and validation of clinical prediction models to distinguish influenza from other viruses causing acute respiratory infections in children and adults.PLoS One. 2019 Feb 11;14(2):e0212050. doi: 10.1371/journal.pone.0212050. eCollection 2019. PLoS One. 2019. PMID: 30742654 Free PMC article.
-
Respiratory viral infections and host responses; insights from genomics.Respir Res. 2016 Nov 21;17(1):156. doi: 10.1186/s12931-016-0474-9. Respir Res. 2016. PMID: 27871304 Free PMC article. Review.
-
[Microbiological diagnosis of viral respiratory infections].Enferm Infecc Microbiol Clin. 2009 Mar;27(3):168-77. doi: 10.1016/j.eimc.2008.03.004. Epub 2009 Feb 11. Enferm Infecc Microbiol Clin. 2009. PMID: 19306718 Free PMC article. Review. Spanish.
Cited by
-
Temporal dynamics of the transcriptional response to dengue virus infection in Nicaraguan children.PLoS Negl Trop Dis. 2012;6(12):e1966. doi: 10.1371/journal.pntd.0001966. Epub 2012 Dec 20. PLoS Negl Trop Dis. 2012. PMID: 23285306 Free PMC article.
-
Microarray analysis of microRNA expression in peripheral blood mononuclear cells of critically ill patients with influenza A (H1N1).BMC Infect Dis. 2013 Jun 3;13:257. doi: 10.1186/1471-2334-13-257. BMC Infect Dis. 2013. PMID: 23731466 Free PMC article.
-
A host transcriptional signature for presymptomatic detection of infection in humans exposed to influenza H1N1 or H3N2.PLoS One. 2013;8(1):e52198. doi: 10.1371/journal.pone.0052198. Epub 2013 Jan 9. PLoS One. 2013. PMID: 23326326 Free PMC article.
-
C1 esterase inhibitor-mediated immunosuppression in COVID-19: Friend or foe?Clin Immunol Commun. 2022 Dec;2:83-90. doi: 10.1016/j.clicom.2022.05.001. Epub 2022 May 5. Clin Immunol Commun. 2022. PMID: 38013973 Free PMC article. Review.
-
Upregulation of interleukin-19 in saliva of patients with COVID-19.Sci Rep. 2022 Sep 26;12(1):16019. doi: 10.1038/s41598-022-20087-w. Sci Rep. 2022. PMID: 36163397 Free PMC article.
References
-
- Acharya CR, Hsu DS, Anders CK, Anguiano A, Salter KH, Walters KS, Redman RC, Tuchman SA, Moylan CA, Mukherjee S, et al. Gene expression signatures, clinicopathological features, and individualized therapy in breast cancer. Jama. 2008;299:1574–1587. - PubMed
-
- Barrett B, Brown R, Voland R, Maberry R, Turner R. Relations among questionnaire and laboratory measures of rhinovirus infection. Eur Respir J. 2006;28:358–363. - PubMed
Publication types
MeSH terms
Associated data
- Actions
Grants and funding
LinkOut - more resources
Full Text Sources
Other Literature Sources
Medical
Molecular Biology Databases
