

Exaggerated inflammatory response of primary human myeloid dendritic cells to lipopolysaccharide in patients with inflammatory bowel disease
- PMID: 19664152
- PMCID: PMC2745038
- DOI: 10.1111/j.1365-2249.2009.03981.x
Exaggerated inflammatory response of primary human myeloid dendritic cells to lipopolysaccharide in patients with inflammatory bowel disease
Abstract
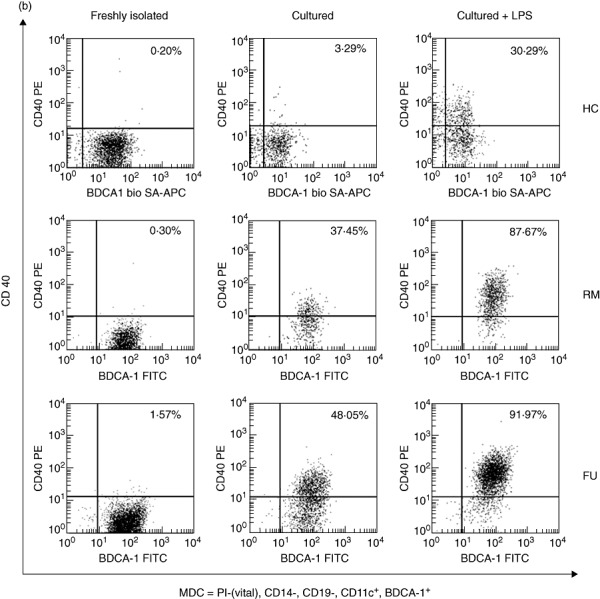
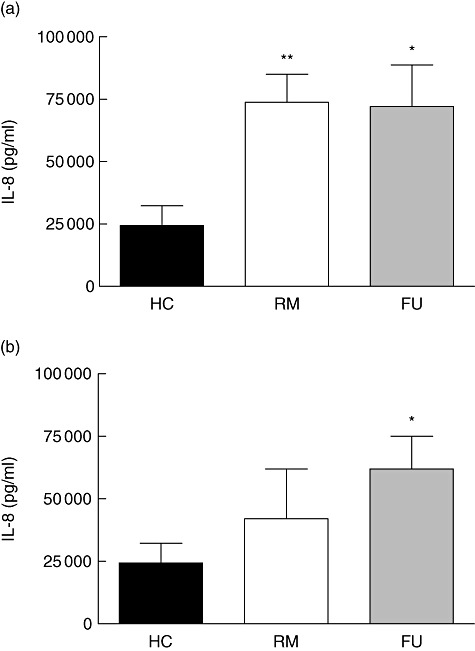
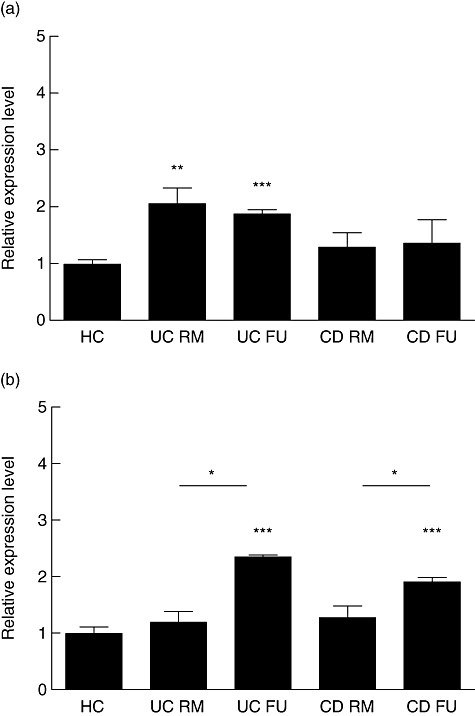
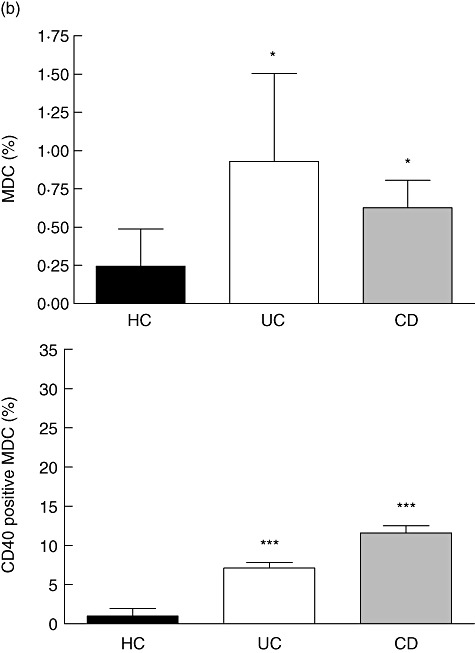
Inflammatory bowel disease (IBD) results from a breakdown of tolerance towards the indigenous flora in genetically susceptible hosts. Failure of dendritic cells (DC) to interpret molecular microbial patterns appropriately when directing innate and adaptive immune responses is conceivable. Primary (conventional, non-monocyte generated) CD1c(+)CD11c(+)CD14(-)CD16(-)CD19(-) myeloid blood or mucosal dendritic cells (mDC) from 76 patients with Crohn's disease (CD) or ulcerative colitis (UC) in remission, during flare-ups (FU) and 76 healthy or non-IBD controls were analysed by fluorescence activated cell sorter (FACS) flow cytometry and real-time polymerase chain reaction. Cytokine secretion of freshly isolated, cultured and lipopolysaccharide (LPS)-stimulated highly purified mDC (purity >95%) was assessed using cytometric bead arrays (CBA). More cultured and stimulated circulating mDC express CD40 in IBD patients. Stimulated circulating mDC from IBD patients secrete significantly more tumour necrosis factor (TNF)-alpha and interleukin (IL)-8. Toll-like receptor (TLR)-4 expression by mDC was higher in remission and increased significantly in flaring UC and CD patients compared with remission (P < 0.05) and controls (P < 0.001). Fluorochrome-labelled LPS uptake by mDC was evaluated at different time-points over 24 h by measuring mean fluorescence intensity (MFI). Circulating mDC from IBD patients take up more LPS and the uptake begins earlier compared with controls (P < 0.05 in CD-FU and UC-FU at 24 h). The frequency of mucosal mDC (P < 0.05) and the number of CD40 expressing mucosal mDC is significantly greater in UC and CD compared with non-IBD controls (P < 0.001 versus P < 0.01, respectively). Our data suggest an aberrant LPS response of mDC in IBD patients, resulting in an inflammatory phenotype and possibly intestinal homing in acute flares.
Figures


Similar articles
-
Patients with active inflammatory bowel disease lack immature peripheral blood plasmacytoid and myeloid dendritic cells.Gut. 2005 Feb;54(2):228-36. doi: 10.1136/gut.2004.040360. Gut. 2005. PMID: 15647187 Free PMC article.
-
Anti-inflammatory effects of Saccharomyces boulardii mediated by myeloid dendritic cells from patients with Crohn's disease and ulcerative colitis.Am J Physiol Gastrointest Liver Physiol. 2011 Dec;301(6):G1083-92. doi: 10.1152/ajpgi.00217.2011. Epub 2011 Sep 8. Am J Physiol Gastrointest Liver Physiol. 2011. PMID: 21903765
-
Aberrant plasmacytoid dendritic cell distribution and function in patients with Crohn's disease and ulcerative colitis.Clin Exp Immunol. 2011 Oct;166(1):46-54. doi: 10.1111/j.1365-2249.2011.04439.x. Epub 2011 Jul 15. Clin Exp Immunol. 2011. PMID: 21762123 Free PMC article.
-
Development, validation and implementation of an in vitro model for the study of metabolic and immune function in normal and inflamed human colonic epithelium.Dan Med J. 2015 Jan;62(1):B4973. Dan Med J. 2015. PMID: 25557335 Review.
-
Innate and adaptive immunity in inflammatory bowel disease.Autoimmun Rev. 2014 Jan;13(1):3-10. doi: 10.1016/j.autrev.2013.06.004. Epub 2013 Jun 15. Autoimmun Rev. 2014. PMID: 23774107 Review.
Cited by
-
Human intestinal stromal cells promote homeostasis in normal mucosa but inflammation in Crohn's disease in a retinoic acid-deficient manner.Mucosal Immunol. 2024 Oct;17(5):958-972. doi: 10.1016/j.mucimm.2024.06.009. Epub 2024 Jun 28. Mucosal Immunol. 2024. PMID: 38945396 Free PMC article.
-
Elevated CD1c+ Myeloid Dendritic Cell Proportions Associate With Clinical Activity and Predict Disease Reactivation in Noninfectious Uveitis.Invest Ophthalmol Vis Sci. 2016 Apr;57(4):1765-72. doi: 10.1167/iovs.15-18357. Invest Ophthalmol Vis Sci. 2016. PMID: 27070110 Free PMC article.
-
Lactobacillus plantarum MYL26 induces endotoxin tolerance phenotype in Caco-2 cells.BMC Microbiol. 2013 Aug 10;13:190. doi: 10.1186/1471-2180-13-190. BMC Microbiol. 2013. PMID: 23937116 Free PMC article.
-
Dendritic cells expressing immunoreceptor CD300f are critical for controlling chronic gut inflammation.J Clin Invest. 2017 May 1;127(5):1905-1917. doi: 10.1172/JCI89531. Epub 2017 Apr 17. J Clin Invest. 2017. PMID: 28414292 Free PMC article.
-
Role of glycolysis in inflammatory bowel disease and its associated colorectal cancer.Front Endocrinol (Lausanne). 2023 Oct 10;14:1242991. doi: 10.3389/fendo.2023.1242991. eCollection 2023. Front Endocrinol (Lausanne). 2023. PMID: 37881499 Free PMC article. Review.
References
-
- Xavier RJ, Podolsky DK. Unravelling the pathogenesis of inflammatory bowel disease. Nature. 2007;448:427–34. - PubMed
-
- Baumgart DC, Carding SR. Inflammatory bowel disease: cause and immunobiology. Lancet. 2007;369:1627–40. - PubMed
-
- Iwasaki A, Medzhitov R. Toll-like receptor control of the adaptive immune responses. Nat Immunol. 2004;5:987–95. - PubMed
-
- Iwasaki A. Mucosal dendritic cells. Annu Rev Immunol. 2007;25:381–418. - PubMed
-
- Kelsall BL, Leon F. Involvement of intestinal dendritic cells in oral tolerance, immunity to pathogens, and inflammatory bowel disease. Immunol Rev. 2005;206:132–48. - PubMed
Publication types
MeSH terms
Substances
LinkOut - more resources
Full Text Sources
Other Literature Sources
Research Materials
