. 2009 Sep;119(9):2758-71.
doi: 10.1172/JCI39162. Epub 2009 Aug 3.

Sirt3 blocks the cardiac hypertrophic response by augmenting Foxo3a-dependent antioxidant defense mechanisms in mice

Affiliations

Sirt3 blocks the cardiac hypertrophic response by augmenting Foxo3a-dependent antioxidant defense mechanisms in mice

Nagalingam R Sundaresan et al. J Clin Invest. 2009 Sep.

Abstract

Sirtuin 3 (SIRT3) is a member of the sirtuin family of proteins that promote longevity in many organisms. Increased expression of SIRT3 has been linked to an extended life span in humans. Here, we have shown that Sirt3 protects the mouse heart by blocking the cardiac hypertrophic response. Although Sirt3-deficient mice appeared to have normal activity, they showed signs of cardiac hypertrophy and interstitial fibrosis at 8 weeks of age. Application of hypertrophic stimuli to these mice produced a severe cardiac hypertrophic response, whereas Sirt3-expressing Tg mice were protected from similar stimuli. In primary cultures of cardiomyocytes, Sirt3 blocked cardiac hypertrophy by activating the forkhead box O3a-dependent (Foxo3a-dependent), antioxidant-encoding genes manganese superoxide dismutase (MnSOD) and catalase (Cat), thereby decreasing cellular levels of ROS. Reduced ROS levels suppressed Ras activation and downstream signaling through the MAPK/ERK and PI3K/Akt pathways. This resulted in repressed activity of transcription factors, specifically GATA4 and NFAT, and translation factors, specifically eukaryotic initiation factor 4E (elf4E) and S6 ribosomal protein (S6P), which are involved in the development of cardiac hypertrophy. These results demonstrate that SIRT3 is an endogenous negative regulator of cardiac hypertrophy, which protects hearts by suppressing cellular levels of ROS.


Figures
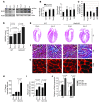
Figure 1
Figure 1. Sirt3 is required to block cardiac hypertrophic response.
(A) Expression levels of 2 forms of Sirt3 in different models of cardiac hypertrophy. Western blotting analysis of heart samples of mice subjected to chronic infusion of agonists, ISO, Ang II, or PE as well as of aortic banding (Band) or forced swimming exercise (exer). (B) Quantification of 2 forms of Sirt3 in different models of hypertrophy. (C) Percentage of cardiac hypertrophy in response to different stimuli. Values are mean ± SEM, n = 5–10. (D) HW/BW ratios of WT and Sirt3-KO mice infused with either vehicle (sham) or Ang II for 14 days. Values are mean ± SEM. (E) H&E-stained sections of hearts from WT and Sirt3-KO mice subjected to Ang II–mediated hypertrophy show gross changes of cardiac hypertrophy. (F) Sections of hearts stained with Masson’s trichrome to detect fibrosis (blue). (G) Heart sections stained with wheat germ agglutinin to demarcate cell boundaries. Original magnification, ×4 (E); ×40 (F); ×400 (G). (H and I) Quantification of fibrosis and myocyte cross-sectional area in control (sham) and Ang II–treated WT and Sirt3-KO mice hearts. (J) Anf and Myh7 mRNA levels in heart samples of control (sham) and Ang II–treated WT and Sirt3-KO mice. Mean ± SEM (n = 4–8). Cont, control.
Figure 2
Figure 2. Sirt3 overexpression blocks cardiac hypertrophic response in vitro.
(A) Rat cardiomyocytes were overexpressed with Sirt3 WT (Ad.Sirt3) or mutant virus (Ad.Smut) and then treated with PE (20 μM) for 48 hours. Incorporation of [3H]-leucine into total cellular protein was determined and normalized to DNA content of the cells. Values are mean ± SEM (n = 5). (B and C) Cardiomyocytes expressing Ad.Sirt3 or Ad.Smut viruses were transfected with a CARP promoter/luciferase reporter vector (CARP-Luc) or β-MHC promoter/luciferase reporter vector (β-MHC–Luc). Cells were treated with vehicle (Veh) or PE (20 μM), and the luciferase activity was measured 48 hours after treatment. A β-gal/reporter plasmid was used as a reference control. Values are mean ± SEM (n = 3). (D) Cardiomyocytes were infected with the indicated adenoviruses and then stimulated with PE (20 μM), Ang II (2 μM), or vehicle for 48 hours. ANF release (green) was determined by staining cells with anti-ANF antibody. DAPI stain was used to mark the position of nuclei. (E) Reorganization of sarcomeres after PE treatment of cells. Cells were treated as in D and immunostained with α-actinin antibody for visualization of sarcomeres. Original magnification, ×630 (D); ×1,000 (E).
Figure 3
Figure 3. Sirt3-Tg mice are protected from agonist-mediated cardiac hypertrophy.
(A) A schematic of Tg construct used to generate mSirt3-Tg mouse lines. (B) Sirt3 (28 kDa) expression analysis in 2 N-Tg and 3 Sirt3-Tg mouse lines. (C) Quantitative analysis of expression of Sirt3 (28 kDa) in N-Tg and Sirt3-Tg mice lines. (D) N-Tg and mSirt3-Tg mice were treated with either vehicle (Sham) or Ang II (3.0 mg/kg per day for 14 days), and their HW/BW ratios were determined. (E) Representative heart sections stained with Masson’s trichrome for detecting fibrosis in N-Tg and Sirt3-Tg mice subjected to Ang II–mediated hypertrophy. Original magnification, ×40. (F) Quantification of fibrosis in N-Tg and Sirt3-Tg mouse hearts after Ang II treatment. (G) ANF and Myh7 mRNA levels in hearts of N-Tg and Sirt3-Tg mice treated with either vehicle (Sham) or Ang II. Values indicate relative expression levels to sham-operated group (mean ± SEM; n = 5 [D, F, and G]).
Figure 4
Figure 4. Sirt3-Tg mice subjected to agonist-mediated cardiac hypertrophy show preserved cardiac functions.
Echocardiography was performed on WT, Sirt3-KO, N-Tg controls, and Sirt3-Tg mice before (pre) and after (post) infusion of ISO (8.7 mg/kg/d) for 7 days. LV wall thickness and fractional shortening (FS) were measured as described in Methods. Values are mean ± SEM, n = 5.
Figure 5
Figure 5. Sirt3 inhibits activation of transcription and translation regulators involved in development of hypertrophy.
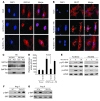
(A and B) Rat cardiomyocytes were infected with Ad.Sirt3 or Ad.Smut viruses and then stimulated with either vehicle or PE (20 μM) for 2 hours. Cells were stained for GATA4 (A) or NFAT (B), and subcellular localization of factors was determined by confocal microscopy. Positions of nuclei were determined by DAPI stain (blue). Original magnification, ×630 (A and B). (C) Cardiomyocytes were infected with viruses and treated with PE as in A. Cytoplasmic (Cyto) and nuclear (Nucl) fractions of myocytes were generated and analyzed by Western blotting. (D) Cardiomyocytes expressing the indicated adenoviruses were transfected with a basic luciferase plasmid (B-Luc) or NFAT-responsive/luciferase (NFAT-Luc) reporter plasmid. On the second day after transfection, cells were treated with PE (20 μM), and the luciferase activity was determined 24 hours after transfection. Values are normalized with the protein content of the cell (mean ± SEM, n = 5). (E) Cardiomyocytes were infected with the indicated adenoviruses and induced with PE (20 μM). Cells were harvested at different time points after PE treatment, and the lysate was analyzed by Western blotting. (F and G) Heart extracts of mice subjected to Ang II–mediated hypertrophy were analyzed by Western blotting. Results are shown for 2 mice of the same group. WT and N-Tg mice are controls of the same genetic background for Sirt3-KO and Sirt3-Tg mice, respectively.
Figure 6
Figure 6. Sirt3 blocks the agonist-induced signaling pathways involved in development of cardiac hypertrophy.
(A) Rat cardiomyocytes were infected with Ad.Sirt3 or Ad.Smut viruses and treated with PE (20 μM) for the indicated time intervals (0, 5, and 60 minutes). Cell lysate was analyzed by Western blotting with kinase-specific and phospho-kinase–specific antibodies. Numbers in parentheses indicate the position of the phospho–amino acid recognized by the antibody. (B) ERK1/2 phosphorylation was analyzed 24 hours after PE-treatment of cells. (C) Heart extract prepared from N-Tg and Sirt3-Tg mice subjected to Ang II–mediated hypertrophy was analyzed by Western-blotting with antibodies against different kinases as indicated. Results are shown for 2 mice of each group.
Figure 7
Figure 7. Sirt3 blocks Ras activation and mitochondrial ROS accumulation during hypertrophy.
(A) Rat cardiomyocytes were infected with the indicated adenoviruses and treated with PE (20 μM) for indicated time intervals. From the cell extract, Raf was immunoprecipitated with use of Raf-RBD beads, and the complex was analyzed for coprecipitation of active Ras by Western blotting (WB). Sirt3 overexpression suppressed the Ras-Raf binding both at 5 and 10 minutes after PE treatment, an indication of Ras deactivation. (B and C) Heart extracts of different groups of mice subjected to ISO-mediated hypertrophy were analyzed for coprecipitation of active Ras with Raf-RBD. Ras was highly activated in Sirt3-KO hearts, whereas it was suppressed in Sirt3-Tg hearts compared with controls. (D) Real-time measurement of mitochondrial ROS production in rat cardiomyocytes infected with Ad.Sirt3 or Ad.Smut virus. Cells were induced with 20 μM of PE in a thermoregulatory chamber of microscope, and the production of ROS (red fluorescence) from cells was determined at regular intervals with use of MitoSox dye by time-lapse confocal microscopy. (E) The increase of ROS was quantified by measurement of the intensity of fluorescence at different time intervals (mean ± SEM, n = 100 cells). *P < 0.01 compared with Ad.Sirt3-infected cells. (F) Cardiomyocytes cultured from neonatal hearts of Sirt3-KO and WT mice were stimulated with PE (20 μM) and ROS production measured as in D. (G) Quantification of ROS levels in 2 groups of cardiomyocytes shown in F (mean ± SEM, n = 50 cells). *P < 0.01 compared with WT cells. Original magnification, ×630 (D and F). GST, glutathione-S-transferase.
Figure 8
Figure 8. Sirt3 enhances the synthesis of the antioxidants, MnSOD and catalase.
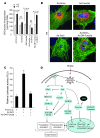
(A) Level of induction of mRNA of MnSOD and Cat in rat cardiomyocytes infected with Ad.Sirt3 or Ad.Smut viruses. Values are mean ± SEM of triplicates (*P < 0.01) (B) Western analysis of MnSOD and catalase levels in cardiac extracts of different group of mice (2 hearts in each group). (C) Western analysis of MnSOD levels from different groups of mice subjected to ISO-mediated cardiac hypertrophy. (D) Enzymatic activities of MnSOD and catalase in hearts of different groups of mice, subjected to chronic infusion of vehicle, Ang II, or ISO (mean ± SEM, n = 6; *P < 0.01). Sirt3 overexpression prevented the agonist-mediated decline of cardiac levels of MnSOD and catalase.
Figure 9
Figure 9. Sirt3 binds, deacetylates, and activates Foxo3a.
(A) Lysate of cells overexpressed with Flag or Flag.Sirt3 was subjected to immunoprecipitation with Flag-M2 agarose beads. The resulting complex was analyzed by Western blotting with anti-Foxo3a antibody. (B) Lysate of cells infected with Ad.Sirt3 virus was subjected to immunoprecipitation with anti-Foxo3a antibody, and the resulting complex was analyzed by Western blotting with anti-Sirt3 antibody. (C) Sirt3 deacetylates Foxo3a. Cells were overexpressed with Flag.Foxo3a and then treated with H2O2 to induce protein acetylation. Flag.Foxo3a was immunoprecipitated and subjected to deacetylation with Sirt3 or Sirt1 in the presence or absence of NAD in the buffer. Protein acetylation was determined by Western blotting with anti–Ac-K and anti-Flag antibodies. (D) Cytoplasmic and nuclear fractions of cardiomyocytes infected with Ad.Sirt3 or Ad.Smut viruses were prepared and analyzed by Western blotting with Foxo3a antibody. Histone 3 and GAPDH were utilized as nuclear and cytoplasmic markers, respectively. (E) Confocal analysis of Foxo3a localization (red) in cardiomyocytes infected with Ad.Sirt3 or Ad.Smut and treated with PE. Positions of nuclei were determined by DAPI stain (blue). Original magnification, ×1,000. (F) Overexpression of Sirt3 activates Foxo3a-dependent promoters. Neonatal rat cardiomyocytes were infected with viruses synthesizing Sirt1, Sirt3, or a mutant protein. The next morning cells were transfected with a Foxo3a expression plasmid and a Foxo3a responsive/luciferase reporter plasmid in different combinations as indicated. Luciferase activity was determined 48 hours after transfection. Sirt3 overexpression significantly activated Foxo3a-dependent promoter. Mean ± SEM, n = 4.
Figure 10
Figure 10. A DN-Foxo3a eliminates the antihypertrophic effect of Sirt3.
Cardiomyocytes were prepared from neonatal Sirt3-KO mice. They were infected with different combinations of adenoviruses as indicated and then stimulated with PE (20 μM) for 48 hours. (A) Measurement of [3H]-leucine incorporation into total cellular protein (mean ± SEM, n = 5; P < 0.01). (B) Immunostaining of cells with anti-ANF (red) and anti–α-actinin (green) antibodies. Positions of nuclei were determined by DAPI staining (blue). Original magnification, ×1,000. (C) The DN-Foxo3a inhibits the activity of endogenous Foxo3a. Cardiomyocytes were overexpressed with a Foxo3a responsive/luciferase reporter plasmid and viruses synthesizing Sirt3 or DN-Foxo3a in different combinations, as indicated. The luciferase activity was determined 48 hours after transfection. All values are normalized to protein content of the cell (mean ± SEM, n = 4; *P < 0.01). The DN-Foxo3a was capable of blocking Sirt3-dependent activation of Foxo-promoter activity. (D) Scheme illustrating signaling pathways modified by Sirt3 to block the cardiac hypertrophic response. Sirt3 levels are elevated during stress of cardiomyocytes, which deacetylates Foxo3a and traps it inside the nucleus to enhance the transcription of Foxo-dependent antioxidant genes, MnSOD and Cat. Increased expression of MnSOD and catalase suppresses ROS levels generated by stress stimuli. Because ROS is the second messenger of hypertrophic signaling pathways, suppression of ROS levels shuts down major signaling pathways involved in activation of transcription and translation events contributing to the cardiac hypertrophic response.

Similar articles

Cited by

References

    1. Frey N., Katus H.A., Olson E.N., Hill J.A. Hypertrophy of the heart: a new therapeutic target? Circulation. 2004;109:1580–1589. doi: 10.1161/01.CIR.0000120390.68287.BB. - DOI - PubMed
    1. Fiedler B., Wollert K.C. Interference of antihypertrophic molecules and signaling pathways with the Ca2+-calcineurin-NFAT cascade in cardiac myocytes. Cardiovasc. Res. 2004;63:450–457. doi: 10.1016/j.cardiores.2004.04.002. - DOI - PubMed
    1. Heineke J., Molkentin J.D. Regulation of cardiac hypertrophy by intracellular signalling pathways. Nat. Rev. Mol. Cell Biol. 2006;7:589–600. - PubMed
    1. Blander G., Guarente L. The Sir2 family of protein deacetylases. Annu. Rev. Biochem. 2004;73:417–435. doi: 10.1146/annurev.biochem.73.011303.073651. - DOI - PubMed
    1. Scher M.B., Vaquero A., Reinberg D. SirT3 is a nuclear NAD+-dependent histone deacetylase that translocates to the mitochondria upon cellular stress. Genes Dev. 2007;21:920–928. doi: 10.1101/gad.1527307. - DOI - PMC - PubMed

Publication types

MeSH terms