

Evidence for heteromorphic chromatin fibers from analysis of nucleosome interactions
- PMID: 19651606
- PMCID: PMC2726360
- DOI: 10.1073/pnas.0903280106
Evidence for heteromorphic chromatin fibers from analysis of nucleosome interactions
Abstract
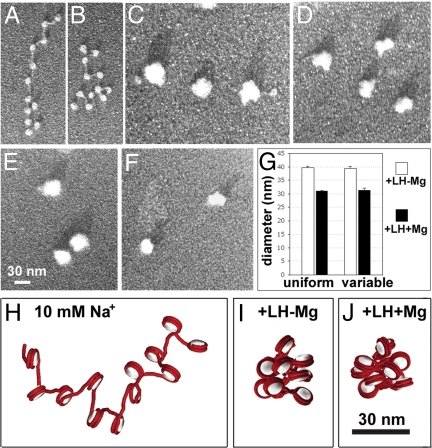
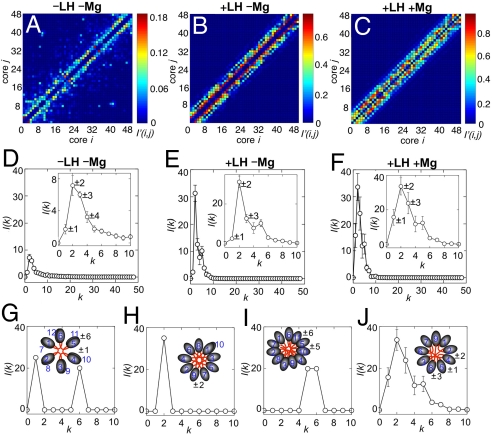
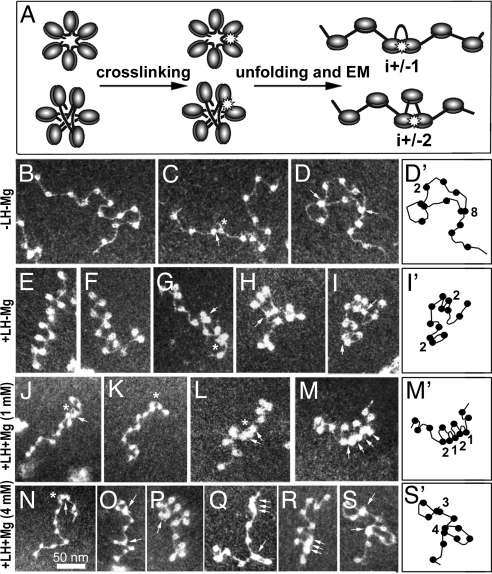
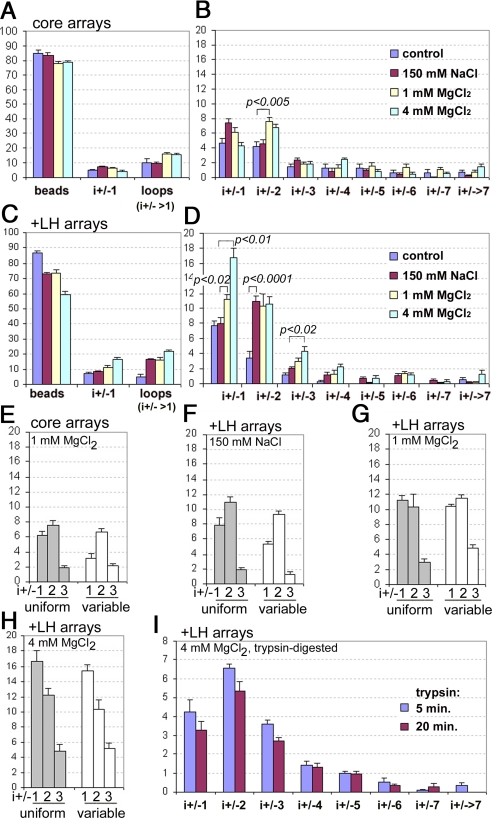
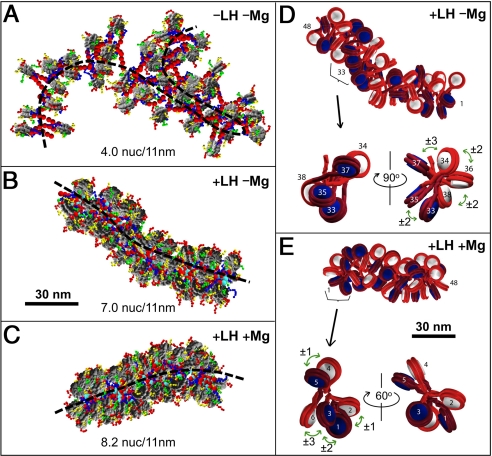
The architecture of the chromatin fiber, which determines DNA accessibility for transcription and other template-directed biological processes, remains unknown. Here we investigate the internal organization of the 30-nm chromatin fiber, combining Monte Carlo simulations of nucleosome chain folding with EM-assisted nucleosome interaction capture (EMANIC). We show that at physiological concentrations of monovalent ions, linker histones lead to a tight 2-start zigzag dominated by interactions between alternate nucleosomes (i +/- 2) and sealed by histone N-tails. Divalent ions further compact the fiber by promoting bending in some linker DNAs and hence raising sequential nucleosome interactions (i +/- 1). Remarkably, both straight and bent linker DNA conformations are retained in the fully compact chromatin fiber as inferred from both EMANIC and modeling. This conformational variability is energetically favorable as it helps accommodate DNA crossings within the fiber axis. Our results thus show that the 2-start zigzag topology and the type of linker DNA bending that defines solenoid models may be simultaneously present in a structurally heteromorphic chromatin fiber with uniform 30 nm diameter. Our data also suggest that dynamic linker DNA bending by linker histones and divalent cations in vivo may mediate the transition between tight nucleosome packing within discrete 30-nm fibers and self-associated higher-order chromosomal forms.
Conflict of interest statement
The authors declare no conflict of interest.
Figures
Similar articles
-
Regulation of chromatin folding by conformational variations of nucleosome linker DNA.Nucleic Acids Res. 2017 Sep 19;45(16):9372-9387. doi: 10.1093/nar/gkx562. Nucleic Acids Res. 2017. PMID: 28934465 Free PMC article.
-
A tale of tails: how histone tails mediate chromatin compaction in different salt and linker histone environments.J Phys Chem A. 2009 Apr 23;113(16):4045-59. doi: 10.1021/jp810375d. J Phys Chem A. 2009. PMID: 19298048 Free PMC article.
-
Nucleosome spacing periodically modulates nucleosome chain folding and DNA topology in circular nucleosome arrays.J Biol Chem. 2019 Mar 15;294(11):4233-4246. doi: 10.1074/jbc.RA118.006412. Epub 2019 Jan 10. J Biol Chem. 2019. PMID: 30630950 Free PMC article.
-
Chromatosome Structure and Dynamics from Molecular Simulations.Annu Rev Phys Chem. 2020 Apr 20;71:101-119. doi: 10.1146/annurev-physchem-071119-040043. Epub 2020 Feb 4. Annu Rev Phys Chem. 2020. PMID: 32017651 Review.
-
Structure of the '30 nm' chromatin fibre: a key role for the linker histone.Curr Opin Struct Biol. 2006 Jun;16(3):336-43. doi: 10.1016/j.sbi.2006.05.007. Epub 2006 May 22. Curr Opin Struct Biol. 2006. PMID: 16714106 Review.
Cited by
-
Toward convergence of experimental studies and theoretical modeling of the chromatin fiber.J Biol Chem. 2012 Feb 17;287(8):5183-91. doi: 10.1074/jbc.R111.305763. Epub 2011 Dec 7. J Biol Chem. 2012. PMID: 22157002 Free PMC article. Review.
-
The role of cryptic ancestral symmetry in histone folding mechanisms across Eukarya and Archaea.PLoS Comput Biol. 2024 Jan 5;20(1):e1011721. doi: 10.1371/journal.pcbi.1011721. eCollection 2024 Jan. PLoS Comput Biol. 2024. PMID: 38181064 Free PMC article.
-
Chromatin ionic atmosphere analyzed by a mesoscale electrostatic approach.Biophys J. 2010 Oct 20;99(8):2587-96. doi: 10.1016/j.bpj.2010.08.023. Biophys J. 2010. PMID: 20959100 Free PMC article.
-
Structure of native chromatin fibres revealed by Cryo-ET in situ.Nat Commun. 2023 Oct 10;14(1):6324. doi: 10.1038/s41467-023-42072-1. Nat Commun. 2023. PMID: 37816746 Free PMC article.
-
Sensitive effect of linker histone binding mode and subtype on chromatin condensation.Nucleic Acids Res. 2019 Jun 4;47(10):4948-4957. doi: 10.1093/nar/gkz234. Nucleic Acids Res. 2019. PMID: 30968131 Free PMC article.
References
-
- Felsenfeld G, Groudine M. Controlling the double helix. Nature. 2003;421:448–453. - PubMed
-
- Richmond TJ, Davey CA. The structure of DNA in the nucleosome core. Nature. 2003;423:145–150. - PubMed
-
- Woodcock CL, Dimitrov S. Higher order structure of chromatin and chromosomes. Curr Opin Genet Dev. 2001;11:130–135. - PubMed
-
- Luger K, Hansen JC. Nucleosome and chromatin fiber dynamics. Curr Opin Struct Biol. 2005;15:188–196. - PubMed
-
- Tremethick DJ. Higher-order structures of chromatin: The elusive 30 nm fiber. Cell. 2007;128:651–654. - PubMed
Publication types
MeSH terms
Substances
Grants and funding
LinkOut - more resources
Full Text Sources
Other Literature Sources
