Identification of splenic reservoir monocytes and their deployment to inflammatory sites
- PMID: 19644120
- PMCID: PMC2803111
- DOI: 10.1126/science.1175202
Identification of splenic reservoir monocytes and their deployment to inflammatory sites
Abstract
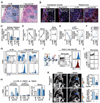
A current paradigm states that monocytes circulate freely and patrol blood vessels but differentiate irreversibly into dendritic cells (DCs) or macrophages upon tissue entry. Here we show that bona fide undifferentiated monocytes reside in the spleen and outnumber their equivalents in circulation. The reservoir monocytes assemble in clusters in the cords of the subcapsular red pulp and are distinct from macrophages and DCs. In response to ischemic myocardial injury, splenic monocytes increase their motility, exit the spleen en masse, accumulate in injured tissue, and participate in wound healing. These observations uncover a role for the spleen as a site for storage and rapid deployment of monocytes and identify splenic monocytes as a resource that the body exploits to regulate inflammation.
Figures


Comment in
-
Immunology. Dispensable but not irrelevant.Science. 2009 Jul 31;325(5940):549-50. doi: 10.1126/science.1178329. Science. 2009. PMID: 19644100 Free PMC article. No abstract available.
Similar articles
-
Immunology. Dispensable but not irrelevant.Science. 2009 Jul 31;325(5940):549-50. doi: 10.1126/science.1178329. Science. 2009. PMID: 19644100 Free PMC article. No abstract available.
-
Splenic Ly6Chi monocytes contribute to adverse late post-ischemic left ventricular remodeling in heme oxygenase-1 deficient mice.Basic Res Cardiol. 2017 Jul;112(4):39. doi: 10.1007/s00395-017-0629-y. Epub 2017 May 22. Basic Res Cardiol. 2017. PMID: 28534119 Free PMC article.
-
Angiotensin-converting enzyme inhibition prevents the release of monocytes from their splenic reservoir in mice with myocardial infarction.Circ Res. 2010 Nov 26;107(11):1364-73. doi: 10.1161/CIRCRESAHA.110.227454. Epub 2010 Oct 7. Circ Res. 2010. PMID: 20930148 Free PMC article.
-
Monocyte and macrophage heterogeneity in the heart.Circ Res. 2013 Jun 7;112(12):1624-33. doi: 10.1161/CIRCRESAHA.113.300890. Circ Res. 2013. PMID: 23743228 Free PMC article. Review.
-
The multiple roles of monocyte subsets in steady state and inflammation.Cell Mol Life Sci. 2010 Aug;67(16):2685-93. doi: 10.1007/s00018-010-0375-x. Epub 2010 May 1. Cell Mol Life Sci. 2010. PMID: 20437077 Free PMC article. Review.
Cited by
-
Beyond vascular inflammation--recent advances in understanding atherosclerosis.Cell Mol Life Sci. 2015 Oct;72(20):3853-69. doi: 10.1007/s00018-015-1971-6. Epub 2015 Jun 23. Cell Mol Life Sci. 2015. PMID: 26100516 Free PMC article. Review.
-
Role of CCR2+ Myeloid Cells in Inflammation Responses Driven by Expression of a Surfactant Protein-C Mutant in the Alveolar Epithelium.Front Immunol. 2021 Apr 22;12:665818. doi: 10.3389/fimmu.2021.665818. eCollection 2021. Front Immunol. 2021. PMID: 33968067 Free PMC article.
-
Waking up the stem cell niche: how hematopoietic stem cells generate inflammatory monocytes after stroke.Circ Res. 2015 Jan 30;116(3):389-92. doi: 10.1161/CIRCRESAHA.114.305678. Circ Res. 2015. PMID: 25634966 Free PMC article. No abstract available.
-
Monocyte heterogeneity in cardiovascular disease.Semin Immunopathol. 2013 Sep;35(5):553-62. doi: 10.1007/s00281-013-0387-3. Epub 2013 Jul 10. Semin Immunopathol. 2013. PMID: 23839097 Free PMC article. Review.
-
The stromal vascular fraction mitigates radiation-induced gastrointestinal syndrome in mice.Stem Cell Res Ther. 2021 May 29;12(1):309. doi: 10.1186/s13287-021-02373-y. Stem Cell Res Ther. 2021. PMID: 34051871 Free PMC article.
References
-
- Luster AD, Alon R, von Andrian UH. Nat. Immunol. 2005;6:1182. - PubMed
-
- Ley K, Laudanna C, Cybulsky MI, Nourshargh S. Nat. Rev. Immunol. 2007;7:678. - PubMed
-
- Singer AJ, Clark RA. N. Engl. J. Med. 1999;341:738. - PubMed
-
- Auffray C, Sieweke MH, Geissmann F. Annu. Rev. Immunol. 2009;27:669. - PubMed
-
- Gordon S, Taylor PR. Nat. Rev. Immunol. 2005;5:953. - PubMed
Publication types
MeSH terms
Substances
Associated data
- Actions
Grants and funding
- P50 CA086355-07/CA/NCI NIH HHS/United States
- P01 A154904/PHS HHS/United States
- R24 CA69246/CA/NCI NIH HHS/United States
- U01 HL080731/HL/NHLBI NIH HHS/United States
- U01 HL080731-05/HL/NHLBI NIH HHS/United States
- R00 HL094533/HL/NHLBI NIH HHS/United States
- P01 AI054904-010001/AI/NIAID NIH HHS/United States
- R01 HL096576/HL/NHLBI NIH HHS/United States
- R01 HL095629/HL/NHLBI NIH HHS/United States
- 1R01HL095612/HL/NHLBI NIH HHS/United States
- P50 CA86355/CA/NCI NIH HHS/United States
- U54 CA126515/CA/NCI NIH HHS/United States
- P01 AI054904/AI/NIAID NIH HHS/United States
- P50 CA086355/CA/NCI NIH HHS/United States
LinkOut - more resources
Full Text Sources
Other Literature Sources
Medical
Molecular Biology Databases
Research Materials

