. 2009:5:291.
doi: 10.1038/msb.2009.46. Epub 2009 Jul 28.

The organization of the transcriptional network in specific neuronal classes

Affiliations

The organization of the transcriptional network in specific neuronal classes

Kellen D Winden et al. Mol Syst Biol. 2009.

Abstract

Genome-wide expression profiling has aided the understanding of the molecular basis of neuronal diversity, but achieving broad functional insight remains a considerable challenge. Here, we perform the first systems-level analysis of microarray data from single neuronal populations using weighted gene co-expression network analysis to examine how neuronal transcriptome organization relates to neuronal function and diversity. We systematically validate network predictions using published proteomic and genomic data. Several network modules of co-expressed genes correspond to interneuron development programs, in which the hub genes are known to be critical for interneuron specification. Other co-expression modules relate to fundamental cellular functions, such as energy production, firing rate, trafficking, and synapses, suggesting that fundamental aspects of neuronal diversity are produced by quantitative variation in basic metabolic processes. We identify two transcriptionally distinct mitochondrial modules and demonstrate that one corresponds to mitochondria enriched in neuronal processes and synapses, whereas the other represents a population restricted to the soma. Finally, we show that galectin-1 is a new interneuron marker, and we validate network predictions in vivo using Rgs4 and Dlx1/2 knockout mice. These analyses provide a basis for understanding how specific aspects of neuronal phenotypic diversity are organized at the transcriptional level.


Conflict of interest statement

The authors declare that they have no conflict of interest.

Figures

Figure 1
Figure 1
Network construction and modular organization. This dendrogram represents a visual summary of the network, emphasizing its modular organization. The network itself contains 4097 genes, of which 2983 are assigned to 13 modules. Each gene is represented by a vertical line on the x-axis, and the genes are grouped into branches based on their TO. The y-axis on the dendrogram represents the dissimilarity in expression (1-TO) between neighboring genes in the dendrogram. Branches are isolated using an automatic module detection algorithm (Langfelder et al, 2008) and assigned a color, which is shown on the horizontal bar below the dendrogram. The gray areas denote locations where no group of co-expressed genes is detected, and the genes within these areas are not assigned to any of the modules.
Figure 2
Figure 2
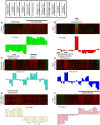
Network modules correspond to known and novel functional distinctions between neuronal subtypes. Heat maps depicting expression of genes (rows) across all samples (columns) are shown for six selected modules: green (#4), red (#11), turquoise (#12), blue (#2), light yellow (#6), and pink (#9). The remaining modules are depicted in Supplementary Figure 1. Within the heat map, red corresponds to high expression and green corresponds to genes that are expressed at a low level. A weighted summary of gene expression (or the module eigengene) is shown below each heat map as a barplot. The black horizontal bar above the heat map denotes the association between the module and neuronal subtypes, and the significance of this association using the Kruskal–Wallis test is reported as the P-value below the heat map. A map of the different neuronal subtypes across the heat maps is located in the upper left. (A) The green (#4) module contains 419 genes and corresponds to genes highly expressed in either glutamatergic or GABAergic neurons (P=2.9e−7). (B) The red (#11) module contains 263 genes in LGN interneurons (P=0.005). (C) The turquoise (#12) module contains 358 genes that are highly expressed in cingulate parvalbumin-positive interneurons and layer V pyramidal neurons (P=9.1e−6). (D) The blue (#2) module contains 252 genes that are highly expressed in hippocampal somatostatin-positive interneurons, cingulate parvalbumin-positive interneurons, and layer V pyramidal neurons (P=1.6e−6). (E) The light yellow (#6) module contains 121 genes that are regulated specifically in telencephalic interneurons, but not other interneurons (P=4.3e−7). (F) The pink (#9) module contains 249 genes that are highly expressed in glutamatergic neurons and downregulated in somatostatin- and parvalbumin-positive interneurons (P=3.0e−7).
Figure 3
Figure 3
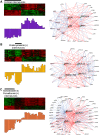
Submodules of the light yellow module define distinct interneuron classes with common developmental origins. Expression within each of these submodules is shown in the heatmap and summarized with the module eigengene (described above). The visualization of these modules was performed using VisANT to plot the 250 strongest connections within each module. Genes that are positively correlated are connected by blue lines, whereas genes that are inversely correlated are connected by red lines. (A) The first submodule contains genes co-regulated in all telencephalic interneurons in this analysis, and Dlx1 and Arx are central genes, which is consistent with their known roles as important interneuron specifiers. (B) The second submodule contains genes regulated in cholecystokinin-positive interneurons, which are derived from the caudal ganglionic eminence. (C) The third submodule contains genes regulated in somatostatin- and parvalbumin-positive interneurons, which are both derived from the medial ganglionic eminence. Lhx6 is highly connected in this module, which is consistent with its role in the development of interneurons from the medial ganglionic eminence.
Figure 4
Figure 4
Galectin-1 is preferentially expressed in somatostatin-positive interneurons. Photomicrographs of galectin-1 (Lgals1) expression in normal adult mouse cortex and counterstaining with interneuron markers. (A) Immunostaining of galectin-1 (red) and somatostatin (green) shows frequent colocalization. (B) Immunostaining of galectin-1 (red) and parvalbumin (green) shows rare colocalization. Quantification of colocalization is shown in the barplot to the right of each figure (±s.e.m.). Scale bar: 20 μm.
Figure 5
Figure 5
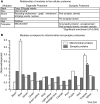
Modules correspond to various aspects of the proteome. Comparison of module membership to the organelle proteome and synaptic proteome. (A) Table depicting modules with nominally significant (P<0.05) enrichment in specific components of either the organelle or synaptic proteome. Three modules have significant overlap with the organelle proteome after strict Bonferroni correction (P<0.004), including the brown (#3), blue (#2), and turquoise (#12) modules. The brown (#3) module overlaps significantly with multiple organelles that are involved in protein trafficking, such as the golgi (P=7.7e−4), recycling endosomes (P=7.4e−11), and the plasma membrane (P=3.0e−5). (B) Barplot showing the comparisons between module membership and the mitochondrial or synaptic proteomes. The y-axis represents the observed to expected ratio of enrichment of either mitochondrial or synaptic proteins (see key) within each module. The asterisk denotes significant enrichment within the module after Bonferroni correction (P<0.004). Mitochondrial proteins are 3.4 (P=6.4e−9) and 2.4 fold (P=5.6e−5) enriched in the blue (#2) and turquoise (#12) modules, respectively. However, the synaptic proteins are only significantly enriched over expected values in the turquoise module (P=2.4e−7).
Figure 6
Figure 6
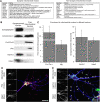
Submodules within the blue and turquoise modules represent different mitochondrial populations. We examined the expression of genes known to be localized to the mitochondria in submodules of both the blue and turquoise modules subcellular fractionation. (A) Table showing the most highly connected genes in the synaptic and non-synaptic mitochondrial submodules, sorted by intramodular connectivity. The genes that are in bold (Vdac2, Uqcrfs1, Phb, Fis1/Ttc11) denote those genes that we chose to experimentally validate. Although Phb and Fis1/Ttc11 are not within the most highly connected genes, they have a kME>0.75. (B) Representative western blots of the synaptosomal and mitochondrial fractions that show the relative enrichment of specific genes within one fraction that was predicted by the network. Control blots of synaptophysin (34 kDa) and cytochrome (c) (14 kDa) show appropriate enrichment in synaptic and mitochondrial fractions, respectively. (C) Three replicate western blots showing the ratios of synaptosomal or mitochondrial enrichment of each of the proteins (±s.e.m.). The genes in the non-synaptic mitochondrial module, Fis1/Ttc11 (17 kDa) and Phb (30 kDa), were enriched 47- and 6-fold in the free mitochondrial fraction versus the synaptosomal fraction, respectively. The genes in the synaptic mitochondrial module, Uqcrfs1 (25 kDa) and Vdac2 (38 kDa), were enriched 8- and 7-fold in the synaptosomal fraction versus the free mitochondrial fraction, respectively. (D) Primary hippocampal neurons after 3 weeks in vitro. MitoTracker (red) was used to label the mitochondria within a neuron, whereas Map2 (blue) was used to label the neuronal processes. Phb (green) is a hub in the non-synaptic mitochondrial module, and it co-localizes with mitochondria mainly within the cell body (arrows). (E) Uqcrfs1 (Green) is a hub in the synaptic mitochondrial module, and it co-localizes primarily with mitochondria in the neuronal processes (arrows), as well as those in the cell body. These data indicate that genes in the synaptic mitochondrial module are enriched in mitochondria that are localized to neuronal processes. Scale Bar: 20 μm.
Figure 7
Figure 7
In vivo validation of network model. Validation of the network model using gene expression data from two separate knockout mice. (A) Barplot representing the observed to expected ratio of differentially expressed genes (P<0.01) by module in the Dlx1/2 knockout mice and (B) Rgs4 knockout mice. In both the cases, only the modules containing the deleted gene were significantly enriched in differentially expressed genes (P<0.05). (C) Relationship between a gene's topological overlap or connectedness with a ‘hub' gene (i.e. Dlx1/Dlx2 or Rgs4) and differential expression. Genes were ranked by connectivity within the module and the number that was differentially expressed within each quartile was counted and expressed as a percentage of total differentially expressed genes within the module. Error bars show the margin of error for the percentages. In both modules, there is a clear relationship in which genes that are highly connected to the deleted gene are more likely to be differentially expressed than other genes that are not as well connected. Nearly 60% of the genes that were differentially expressed in the enriched modules of either knockout strains were in the top quartile of connectivity with the deleted gene, which is significantly greater than other quartiles (P<0.005).

Similar articles

Cited by

References

    1. Albert R, Jeong H, Barabasi A (2000) Error and attack tolerance of complex networks. Nature 406: 378–382 - PubMed
    1. Alifragis P, Liapi A, Parnavelas JG (2004) Lhx6 regulates the migration of cortical interneurons from the ventral telencephalon but does not specify their gaba phenotype. J Neurosci 24: 5643–5648 - PMC - PubMed
    1. Anderson SA, Eisenstat DD, Shi L, Rubenstein JL (1997a) Interneuron migration from basal forebrain to neocortex: dependence on dlx genes. Science 278: 474–476 - PubMed
    1. Anderson SA, Qiu M, Bulfone A, Eisenstat DD, Meneses J, Pedersen R, Rubenstein JL (1997b) Mutations of the homeobox genes dlx-1 and dlx-2 disrupt the striatal subventricular zone and differentiation of late born striatal neurons. Neuron 19: 27–37 - PubMed
    1. Arlotta P, Molyneaux BJ, Chen J, Inoue J, Kominami R, Macklis JD (2005) Neuronal subtype-specific genes that control corticospinal motor neuron development in vivo. Neuron 45: 207–221 - PubMed

Publication types