Isoform specificity of the Na/K-ATPase association and regulation by phospholemman
- PMID: 19638348
- PMCID: PMC2785363
- DOI: 10.1074/jbc.M109.047357
Isoform specificity of the Na/K-ATPase association and regulation by phospholemman
Abstract
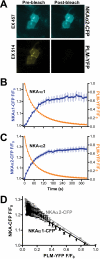
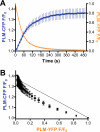
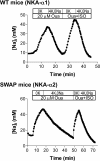
Phospholemman (PLM) phosphorylation mediates enhanced Na/K-ATPase (NKA) function during adrenergic stimulation of the heart. Multiple NKA isoforms exist, and their function/regulation may differ. We combined fluorescence resonance energy transfer (FRET) and functional measurements to investigate isoform specificity of the NKA-PLM interaction. FRET was measured as the increase in the donor fluorescence (CFP-NKA-alpha1 or CFP-NKA-alpha2) during progressive acceptor (PLM-YFP) photobleach in HEK-293 cells. Both pairs exhibited robust FRET (maximum of 23.6 +/- 3.4% for NKA-alpha1 and 27.5 +/- 2.5% for NKA-alpha2). Donor fluorescence depended linearly on acceptor fluorescence, indicating a 1:1 PLM:NKA stoichiometry for both isoforms. PLM phosphorylation induced by cAMP-dependent protein kinase and protein kinase C activation drastically reduced the FRET with both NKA isoforms. However, submaximal cAMP-dependent protein kinase activation had less effect on PLM-NKA-alpha2 versus PLM-NKA-alpha1. Surprisingly, ouabain virtually abolished NKA-PLM FRET but only partially reduced co-immunoprecipitation. PLM-CFP also showed FRET to PLM-YFP, but the relationship during progressive photobleach was highly nonlinear, indicating oligomers involving >or=3 monomers. Using cardiac myocytes from wild-type mice and mice where NKA-alpha1 is ouabain-sensitive and NKA-alpha2 is ouabain-resistant, we assessed the effects of PLM phosphorylation on NKA-alpha1 and NKA-alpha2 function. Isoproterenol enhanced internal Na(+) affinity of both isoforms (K((1/2)) decreased from 18.1 +/- 2.0 to 11.5 +/- 1.9 mm for NKA-alpha1 and from 16.4 +/- 2.5 to 10.4 +/- 1.5 mm for NKA-alpha2) without altering maximum transport rate (V(max)). Protein kinase C activation also decreased K((1/2)) for both NKA-alpha1 and NKA-alpha2 (to 9.4 +/- 1.0 and 9.1 +/- 1.1 mm, respectively) but increased V(max) only for NKA-alpha2 (1.9 +/- 0.4 versus 1.2 +/- 0.5 mm/min). In conclusion, PLM associates with and modulates both NKA-alpha1 and NKA-alpha2 in a comparable but not identical manner.
Figures


Similar articles
-
Phospholemman phosphorylation alters its fluorescence resonance energy transfer with the Na/K-ATPase pump.J Biol Chem. 2006 Oct 27;281(43):32765-73. doi: 10.1074/jbc.M606254200. Epub 2006 Aug 30. J Biol Chem. 2006. PMID: 16943195
-
Phospholemman phosphorylation mediates the protein kinase C-dependent effects on Na+/K+ pump function in cardiac myocytes.Circ Res. 2006 Dec 8;99(12):1376-83. doi: 10.1161/01.RES.0000251667.73461.fb. Epub 2006 Nov 9. Circ Res. 2006. PMID: 17095720
-
Role of phospholemman phosphorylation sites in mediating kinase-dependent regulation of the Na+-K+-ATPase.Am J Physiol Cell Physiol. 2010 Dec;299(6):C1363-9. doi: 10.1152/ajpcell.00027.2010. Epub 2010 Sep 22. Am J Physiol Cell Physiol. 2010. PMID: 20861470 Free PMC article.
-
Coordinated regulation of cardiac Na(+)/Ca (2+) exchanger and Na (+)-K (+)-ATPase by phospholemman (FXYD1).Adv Exp Med Biol. 2013;961:175-90. doi: 10.1007/978-1-4614-4756-6_15. Adv Exp Med Biol. 2013. PMID: 23224879 Review.
-
Role of Na+-K+ ATPase Alterations in the Development of Heart Failure.Int J Mol Sci. 2024 Oct 8;25(19):10807. doi: 10.3390/ijms251910807. Int J Mol Sci. 2024. PMID: 39409137 Free PMC article. Review.
Cited by
-
The human phospholamban Arg14-deletion mutant localizes to plasma membrane and interacts with the Na/K-ATPase.J Mol Cell Cardiol. 2012 Mar;52(3):773-82. doi: 10.1016/j.yjmcc.2011.11.012. Epub 2011 Dec 1. J Mol Cell Cardiol. 2012. PMID: 22155237 Free PMC article.
-
Phosphomimetic mutations enhance oligomerization of phospholemman and modulate its interaction with the Na/K-ATPase.J Biol Chem. 2011 Mar 18;286(11):9120-6. doi: 10.1074/jbc.M110.198036. Epub 2011 Jan 10. J Biol Chem. 2011. PMID: 21220422 Free PMC article.
-
Na⁺/K⁺-ATPase E960 and phospholemman F28 are critical for their functional interaction.Proc Natl Acad Sci U S A. 2012 Dec 11;109(50):20756-61. doi: 10.1073/pnas.1207866109. Epub 2012 Nov 26. Proc Natl Acad Sci U S A. 2012. PMID: 23185013 Free PMC article.
-
Regulation of the cardiac sodium pump.Cell Mol Life Sci. 2013 Apr;70(8):1357-80. doi: 10.1007/s00018-012-1134-y. Epub 2012 Sep 7. Cell Mol Life Sci. 2013. PMID: 22955490 Free PMC article. Review.
-
Specialized Functional Diversity and Interactions of the Na,K-ATPase.Front Physiol. 2016 May 25;7:179. doi: 10.3389/fphys.2016.00179. eCollection 2016. Front Physiol. 2016. PMID: 27252653 Free PMC article. Review.
References
Publication types
MeSH terms
Substances
Grants and funding
LinkOut - more resources
Full Text Sources
Molecular Biology Databases
Miscellaneous

