. 2009 Jul 23;138(2):314-27.
doi: 10.1016/j.cell.2009.04.058.

A multiparameter network reveals extensive divergence between C. elegans bHLH transcription factors

Affiliations

A multiparameter network reveals extensive divergence between C. elegans bHLH transcription factors

Christian A Grove et al. Cell. .

Abstract

Differences in expression, protein interactions, and DNA binding of paralogous transcription factors ("TF parameters") are thought to be important determinants of regulatory and biological specificity. However, both the extent of TF divergence and the relative contribution of individual TF parameters remain undetermined. We comprehensively identify dimerization partners, spatiotemporal expression patterns, and DNA-binding specificities for the C. elegans bHLH family of TFs, and model these data into an integrated network. This network displays both specificity and promiscuity, as some bHLH proteins, DNA sequences, and tissues are highly connected, whereas others are not. By comparing all bHLH TFs, we find extensive divergence and that all three parameters contribute equally to bHLH divergence. Our approach provides a framework for examining divergence for other protein families in C. elegans and in other complex multicellular organisms, including humans. Cross-species comparisons of integrated networks may provide further insights into molecular features underlying protein family evolution. For a video summary of this article, see the PaperFlick file available with the online Supplemental Data.


Figures

Figure 1
Figure 1. Functional and Molecular Divergence in Paralogous TF Families
(A) Paralogous TFs arise by gene duplication and mutation. (B) TF divergence can be achieved by the accumulation of molecular and functional differences. Differently shaped nodes (rectangles, triangles and diamonds) between TFs (circles) represent different TF parameters (e.g. dimerization partners, spatiotemporal expression and DNA binding specificities).
Figure 2
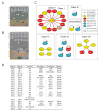
Figure 2. The C. elegans bHLH Dimerization Network
(A) Auto-activation of DB-bHLH Y2H baits. Top - DB-bHLH strains were plated in spots on permissive media; middle - activation of the HIS3 reporter gene ; bottom - activation of the lacZ reporter gene (βGal). Auto-activators are: A1 - DB-AHA-1; A5 - DB-HLH-30; A6 - DB-HLH-2; B3 - DB-HLH-1; B6 - DB-MXL-3; B9 - DB-SBP-1; D3 - DB-HIF-1. (B) Example of Y2H matrix assay using DB-HLH-15 as bait. Top – permissive media; middle - activation of the HIS3 reporter gene; bottom - activation of the lacZ reporter gene (βGal). Bottom spots in each panel - Y2H controls (Walhout and Vidal, 2001). (C) The bHLH dimerization network. Y1H – yeast one-hybrid. (D) Several bHLH dimers identified are evolutionarily conserved interologs.
Figure 3
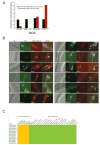
Figure 3. Post-Embryonic Co-Expression of HLH-2 and Its Partners
(A) Tissue overlap coefficient (TsOC) analysis was done as described (Martinez et al., 2008). TsOC=HLHXHLHYHLHN, where HLH-X is the number of tissues where HLH-X is expressed, and HLH-Y is the number of tissues where HLH-Y is expressed. HLH-N is the smallest total number of tissues for either HLH-X or HLH-Y. (B) Phlh-2::mCherry::his-11 transgenic animals were crossed with each of the Phlh-x::GFP animals to determine co-expression (indicated by white arrowheads). (C) Co-expression matrix of HLH-2 and its partners using a controlled vocabulary. Yellow indicates temporal expression; green depicts spatial expression.
Figure 4
Figure 4. PBM Analysis of C. elegans bHLH Dimers
(A) Box plots of enrichment score (ES) distribution of HLH-2, HLH-10 and HLH-2/HLH-10 binding to E-boxes and E-box-related sequences. E-boxes bound preferentially (AUC ≥ 0.85, Q < 0.001) by HLH-2/HLH-10 are indicated in blue (right panel). The corresponding E-boxes are colored gray in the single protein box plots for comparison (left and middle panel). In each box plot, the central bar indicates the median, the edges of the box indicate the 25th and 75th percentiles, the whiskers extend to the most extreme data points not considered outliers, and individual points that are plotted correspond to outliers. (B) Clustergram of all bHLH dimers that yielded DNA binding profiles at a PBM ES ≥ 0.40. Orange box – cluster I; blue box – cluster II. (C) bHLH DNA binding network. bHLH dimers are indicated in circles, E- and E-box-like sequences are indicated in hexagons. Red – cluster I; blue – cluster II. Blue lines –novel interactions; dashed red lines – previously reported interactions. (D) Box plots of ES distribution of HLH-26 and MDL-1/MXL-1 binding to E-boxes and E-box-like sequences. Note: the box plot for CACGTG bound by the MDL-1/MXL-1 heterodimer is barely visible because of its narrow range and high ES. (E) Box plots of ES distribution of nucleotides flanking CACGTG when bound by HLH-26 or MDL-1/MXL-1.
Figure 5
Figure 5. An Integrated bHLH Network
(A) Flow diagram describing how GO annotations were obtained (see Experimental Procedures for details). (B) Integrated bHLH network that combines dimerization, spatiotemporal expression, DNA binding specificities and GO categories. The blue lines depict a “network path” connecting the intestine to the “metabolism” GO category through HLH-30.
Figure 6
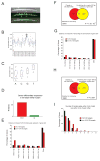
Figure 6. Network validation reveals conserved molecular and biological function of HLH-30
(A) Phlh-30 drives GFP expression in different tissues, including the intestine (white arrows), spermatheca (yellow arrow) and vulva (blue arrow). Top – DIC image; middle –GFP image; bottom – merged images. (B) HLH-30 strongly prefers the CACGTG E-box. (C) HLH-30 strongly favors a 5′king the CACGTG E-box. (D) HLH-30 activates gene expression. The majority of genes that change significantly in hlh-30(tm1978) mutant animals exhibit reduced expression (red), while the expression of a minority is increased (green). (E) Distribution of genes for which the location of the closest HLH-30 binding site upstream of the transcriptional start is in the indicated window of distance (in increments of 500 bp). (F) Venn diagram demonstrating association of gene expression change in hlh-30(tm1978) mutant animals with the region 500 bp upstream of the gene start harboring an HLH-30 binding site. (G) Distribution of genes for which the location of the closest HLH-30 binding site downstream of the gene start is in the indicated genomic regions (in increments of 500 bp). (H) Venn diagram demonstrating association of gene expression change in hlh-30(tm1978) mutant animals with the region 500 bp downstream of the gene start harboring an HLH-30 binding site. (I) HLH-30 targets have two or more HLH-30 binding sites within 2 kb of each other in the region up or downstream of the gene start more often than do non-HLH-30 targets.
Figure 7
Figure 7. Most bHLH proteins differ from each other in multiple functional parameters
(A) For each bHLH-bHLH pair we calculated a Similarity Score (SS) for each functional TF parameter as indicated. (B) Integrated parameter overlap analysis of all bHLH-bHLH pairs and dimer pairs (see Supplemental Figure S12 for individual parameter analysis). SSs were binned into four groups as indicated. (C) Sub-networks of bHLH proteins with the highest degree of similarity. Red lines –unique functional parameters; blue lines – shared functional parameters. Dark blue diamonds – Molecular Function; light blue diamonds - Biological Process. (D) Individual similarity scores for all bHLH-bHLH pairs shown in (C). (E) Detailed analysis of neuronal expression conferred by Phlh-15, Phlh-4 and Phlh-10. Phlh-4::GFP: i) two sensory head neurons (one bilaterally symmetric pair) of the lateral ganglion, likely AWA or AWB; ii) three pairs of tail neurons of the lumbar ganglion, likely PVQ, PVC, PVW, and/or LUA; iii) two tail neurons (likely a bilaterally symmetric pair) of the lumbar ganglion with processes to the tail. Phlh-10::GFP: i) two interneurons (one bilaterally symmetric pair) of the retrovesicular ganglion, likely RIF or RIG; ii) two sensory head neurons (one bilaterally symmetric pair) of the lateral ganglion, likely AWA or AWB. (F) Percentage overlap of candidate target genes comparing bHLH dimers that can bind CACGTG E-boxes. Blue bars indicate comparisons in which both dimers exclusively bind CACGTG, red indicates comparisons in which one or both dimers can also bind other E-boxes or E-box-like sequences.

Similar articles

Cited by

References

    1. Ashrafi K, Chang FY, Watts JL, Fraser AG, Kamath RS, Ahringer J, Ruvkun G. Genome-wide RNAi analysis of Caenorhabditis elegans fat regulatory genes. Nature. 2003;421:268–272. - PubMed
    1. Barrasa MI, Vaglio P, Cavasino F, Jacotot L, Walhout AJM. EDGEdb: a transcription factor-DNA interaction database for the analysis of C. elegans differential gene expression. BMC Genomics. 2007;8:21. - PMC - PubMed
    1. Berger MF, Badis G, Gehrke AR, Talukder S, Philippakis AA, Pena-Castillo L, Alleyne TM, Mnaimneh S, Botvinnik OB, Chan ET, et al. Variation in homeodomain DNA binding revealed by high-resolution analysis of sequence preferences. Cell. 2008;133:1266–1276. - PMC - PubMed
    1. Berger MF, Philippakis AA, Qureshi AM, He FS, Estep PW, 3rd, Bulyk ML. Compact, universal DNA microarrays to comprehensively determine transcription-factor binding site specificities. Nat Biotechnol. 2006;24:1429–1435. - PMC - PubMed
    1. Castillo-Davis CI, Hartl DL, Achaz G. Cis-regulatory and protein evolution in orthologous and duplicate genes. Genome Res. 2004;14:1530–1536. - PMC - PubMed

MeSH terms

Substances

Associated data