

Cooperativity dominates the genomic organization of p53-response elements: a mechanistic view
- PMID: 19629163
- PMCID: PMC2705680
- DOI: 10.1371/journal.pcbi.1000448
Cooperativity dominates the genomic organization of p53-response elements: a mechanistic view
Abstract
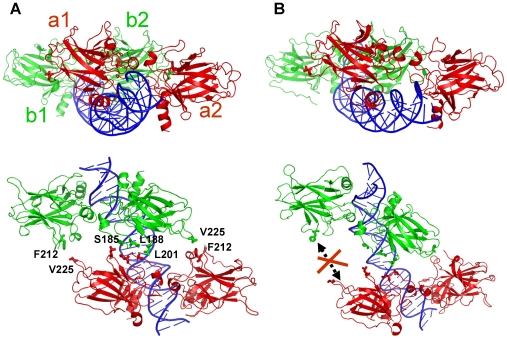
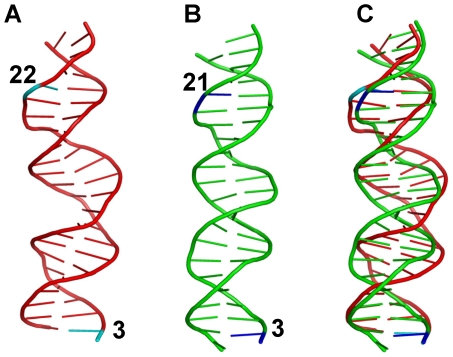
p53-response elements (p53-REs) are organized as two repeats of a palindromic DNA segment spaced by 0 to 20 base pairs (bp). Several experiments indicate that in the vast majority of the human p53-REs there are no spacers between the two repeats; those with spacers, particularly with sizes beyond two nucleotides, are rare. This raises the question of what it indicates about the factors determining the p53-RE genomic organization. Clearly, given the double helical DNA conformation, the orientation of two p53 core domain dimers with respect to each other will vary depending on the spacer size: a small spacer of 0 to 2 bps will lead to the closest p53 dimer-dimer orientation; a 10-bp spacer will locate the p53 dimers on the same DNA face but necessitate DNA looping; while a 5-bp spacer will position the p53 dimers on opposite DNA faces. Here, via conformational analysis we show that when there are 0-2 bp spacers, p53-DNA binding is cooperative; however, cooperativity is greatly diminished when there are spacers with sizes beyond 2 bp. Cooperative binding is broadly recognized to be crucial for biological processes, including transcriptional regulation. Our results clearly indicate that cooperativity of the p53-DNA association dominates the genomic organization of the p53-REs, raising questions of the structural organization and functional roles of p53-REs with larger spacers. We further propose that a dynamic landscape scenario of p53 and p53-REs can better explain the selectivity of the degenerate p53-REs. Our conclusions bear on the evolutionary preference of the p53-RE organization and as such, are expected to have broad implications to other multimeric transcription factor response element organization.
Conflict of interest statement
The authors have declared that no competing interests exist.
Figures
Similar articles
-
Lysine120 interactions with p53 response elements can allosterically direct p53 organization.PLoS Comput Biol. 2010 Aug 5;6(8):e1000878. doi: 10.1371/journal.pcbi.1000878. PLoS Comput Biol. 2010. PMID: 20700496 Free PMC article.
-
Diverse p53/DNA binding modes expand the repertoire of p53 response elements.Proc Natl Acad Sci U S A. 2017 Oct 3;114(40):10624-10629. doi: 10.1073/pnas.1618005114. Epub 2017 Sep 14. Proc Natl Acad Sci U S A. 2017. PMID: 28912355 Free PMC article.
-
Structure of p53 binding to the BAX response element reveals DNA unwinding and compression to accommodate base-pair insertion.Nucleic Acids Res. 2013 Sep;41(17):8368-76. doi: 10.1093/nar/gkt584. Epub 2013 Jul 8. Nucleic Acids Res. 2013. PMID: 23836939 Free PMC article.
-
Roles of p53 Family Structure and Function in Non-Canonical Response Element Binding and Activation.Int J Mol Sci. 2019 Jul 27;20(15):3681. doi: 10.3390/ijms20153681. Int J Mol Sci. 2019. PMID: 31357595 Free PMC article. Review.
-
The p53 response element and transcriptional repression.Cell Cycle. 2010 Mar 1;9(5):870-9. doi: 10.4161/cc.9.5.10825. Epub 2010 Mar 2. Cell Cycle. 2010. PMID: 20160511 Review.
Cited by
-
Lysine120 interactions with p53 response elements can allosterically direct p53 organization.PLoS Comput Biol. 2010 Aug 5;6(8):e1000878. doi: 10.1371/journal.pcbi.1000878. PLoS Comput Biol. 2010. PMID: 20700496 Free PMC article.
-
Roles of computational modelling in understanding p53 structure, biology, and its therapeutic targeting.J Mol Cell Biol. 2019 Apr 1;11(4):306-316. doi: 10.1093/jmcb/mjz009. J Mol Cell Biol. 2019. PMID: 30726928 Free PMC article. Review.
-
Molecular dynamics simulations of double-stranded DNA in an explicit solvent model with the zero-dipole summation method.PLoS One. 2013 Oct 4;8(10):e76606. doi: 10.1371/journal.pone.0076606. eCollection 2013. PLoS One. 2013. PMID: 24124577 Free PMC article.
-
Predicting conformational ensembles and genome-wide transcription factor binding sites from DNA sequences.Sci Rep. 2017 Jun 22;7(1):4071. doi: 10.1038/s41598-017-03199-6. Sci Rep. 2017. PMID: 28642456 Free PMC article.
-
Transcription factor oscillations induce differential gene expressions.Biophys J. 2012 Jun 6;102(11):2413-23. doi: 10.1016/j.bpj.2012.04.023. Epub 2012 Jun 5. Biophys J. 2012. PMID: 22713556 Free PMC article.
References
-
- Kastan MB, Onyekwere O, Sidransky D, Vogelstein B, Craig RW. Participation of p53 protein in the cellular response to DNA damage. Cancer Res. 1991;51:6304–6311. - PubMed
-
- el-Deiry WS. Regulation of p53 downstream genes. Semin Cancer Biol. 1998;8:345–357. - PubMed
-
- Vousden KH. Activation of the p53 tumor suppressor protein. Biochim Biophys Acta. 2002;1602:47–59. - PubMed
-
- el-Deiry WS, Kern SE, Pietenpol JA, Kinzler KW, Vogelstein B. Definition of a consensus binding site for p53. Nat Genet. 1992;1:45–49. - PubMed
Publication types
MeSH terms
Substances
Grants and funding
LinkOut - more resources
Full Text Sources
Research Materials
Miscellaneous
