

Conformational analysis of nucleic acids revisited: Curves+
- PMID: 19625494
- PMCID: PMC2761274
- DOI: 10.1093/nar/gkp608
Conformational analysis of nucleic acids revisited: Curves+
Abstract
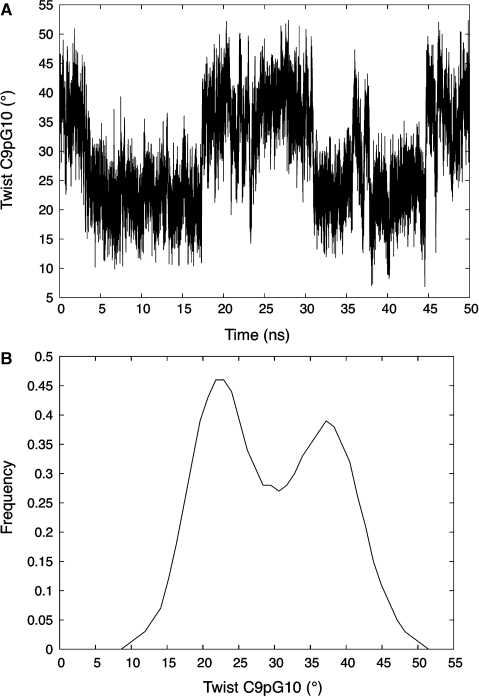
We describe Curves+, a new nucleic acid conformational analysis program which is applicable to a wide range of nucleic acid structures, including those with up to four strands and with either canonical or modified bases and backbones. The program is algorithmically simpler and computationally much faster than the earlier Curves approach, although it still provides both helical and backbone parameters, including a curvilinear axis and parameters relating the position of the bases to this axis. It additionally provides a full analysis of groove widths and depths. Curves+ can also be used to analyse molecular dynamics trajectories. With the help of the accompanying program Canal, it is possible to produce a variety of graphical output including parameter variations along a given structure and time series or histograms of parameter variations during dynamics.
Figures
Similar articles
-
CURVES+ web server for analyzing and visualizing the helical, backbone and groove parameters of nucleic acid structures.Nucleic Acids Res. 2011 Jul;39(Web Server issue):W68-73. doi: 10.1093/nar/gkr316. Epub 2011 May 10. Nucleic Acids Res. 2011. PMID: 21558323 Free PMC article.
-
3DNA: a software package for the analysis, rebuilding and visualization of three-dimensional nucleic acid structures.Nucleic Acids Res. 2003 Sep 1;31(17):5108-21. doi: 10.1093/nar/gkg680. Nucleic Acids Res. 2003. PMID: 12930962 Free PMC article.
-
Structure and conformation of helical nucleic acids: rebuilding program (SCHNArP).J Mol Biol. 1997 Oct 31;273(3):681-91. doi: 10.1006/jmbi.1997.1345. J Mol Biol. 1997. PMID: 9356256
-
1 A crystal structures of B-DNA reveal sequence-specific binding and groove-specific bending of DNA by magnesium and calcium.J Mol Biol. 2000 Aug 25;301(4):915-45. doi: 10.1006/jmbi.2000.4012. J Mol Biol. 2000. PMID: 10966796
-
Structure and conformation of helical nucleic acids: analysis program (SCHNAaP).J Mol Biol. 1997 Oct 31;273(3):668-80. doi: 10.1006/jmbi.1997.1346. J Mol Biol. 1997. PMID: 9356255
Cited by
-
A Bit Stickier, a Bit Slower, a Lot Stiffer: Specific vs. Nonspecific Binding of Gal4 to DNA.Int J Mol Sci. 2021 Apr 7;22(8):3813. doi: 10.3390/ijms22083813. Int J Mol Sci. 2021. PMID: 33916983 Free PMC article.
-
Repair complexes of FEN1 endonuclease, DNA, and Rad9-Hus1-Rad1 are distinguished from their PCNA counterparts by functionally important stability.Proc Natl Acad Sci U S A. 2012 May 29;109(22):8528-33. doi: 10.1073/pnas.1121116109. Epub 2012 May 14. Proc Natl Acad Sci U S A. 2012. PMID: 22586102 Free PMC article.
-
Impact of geometry optimization on base-base stacking interaction energies in the canonical A- and B-forms of DNA.J Phys Chem A. 2013 Feb 21;117(7):1560-8. doi: 10.1021/jp308364d. Epub 2013 Feb 12. J Phys Chem A. 2013. PMID: 23343365 Free PMC article.
-
Importance of base-pair opening for mismatch recognition.Nucleic Acids Res. 2020 Nov 18;48(20):11322-11334. doi: 10.1093/nar/gkaa896. Nucleic Acids Res. 2020. PMID: 33080020 Free PMC article.
-
Enzymatic excision of uracil residues in nucleosomes depends on the local DNA structure and dynamics.Biochemistry. 2012 Jul 31;51(30):6028-38. doi: 10.1021/bi3006412. Epub 2012 Jul 23. Biochemistry. 2012. PMID: 22784353 Free PMC article.
References
-
- Watson JD, Crick FH. Molecular structure of nucleic acids; a structure for deoxyribose nucleic acid. Nature. 1953;171:737–738. - PubMed
-
- Arnott S, Hukins DW. Optimised parameters for A-DNA and B-DNA. Biochem. Biophys. Res. Commun. 1972;47:1504–1509. - PubMed
-
- Arnott S, Hukins DW, Dover SD. Optimised parameters for RNA double-helices. Biochem. Biophys. Res. Commun. 1972;48:1392–1399. - PubMed
-
- Arnott S, Chandrasekaran R, Hukins DW, Smith PJ, Watts L. Structural details of double-helix observed for DNAs containing alternating purine and pyrimidine sequences. J. Mol. Biol. 1974;88:523–533. - PubMed
-
- Leslie AG, Arnott S, Chandrasekaran R, Ratliff RL. Polymorphism of DNA double helices. J. Mol. Biol. 1980;143:49–72. - PubMed
Publication types
MeSH terms
Substances
LinkOut - more resources
Full Text Sources
Other Literature Sources
