Baseline Ad5 serostatus does not predict Ad5 HIV vaccine-induced expansion of adenovirus-specific CD4+ T cells
- PMID: 19620962
- PMCID: PMC2723179
- DOI: 10.1038/nm.1989
Baseline Ad5 serostatus does not predict Ad5 HIV vaccine-induced expansion of adenovirus-specific CD4+ T cells
Erratum in
- Nat Med. 2009 Nov;15(11):1333. Makedonas, George [added]
Abstract
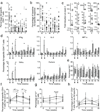
The mechanisms underlying possible increased HIV-1 acquisition in adenovirus 5 (Ad5)-seropositive subjects vaccinated with Ad5-HIV-1 vectors in the Merck STEP trial remain unclear. We find that Ad5 serostatus does not predict Ad5-specific CD4(+) T cell frequency, and we did not observe durable significant differences in Ad5-specific CD4(+) T cells between Ad5-seropositive and Ad5-seronegative subjects after vaccination. These findings indicate no causative role for Ad5-specific CD4(+) T cells in increasing HIV-1 susceptibility in the STEP trial.
Figures


Similar articles
-
Adenovirus-specific immunity after immunization with an Ad5 HIV-1 vaccine candidate in humans.Nat Med. 2009 Aug;15(8):873-5. doi: 10.1038/nm.1991. Epub 2009 Jul 20. Nat Med. 2009. PMID: 19620961 Free PMC article. Clinical Trial.
-
Adenovirus vector vaccination induces expansion of memory CD4 T cells with a mucosal homing phenotype that are readily susceptible to HIV-1.Proc Natl Acad Sci U S A. 2009 Nov 24;106(47):19940-5. doi: 10.1073/pnas.0907898106. Epub 2009 Nov 16. Proc Natl Acad Sci U S A. 2009. PMID: 19918060 Free PMC article.
-
Preferential infection of human Ad5-specific CD4 T cells by HIV in Ad5 naturally exposed and recombinant Ad5-HIV vaccinated individuals.Proc Natl Acad Sci U S A. 2014 Sep 16;111(37):13439-44. doi: 10.1073/pnas.1400446111. Epub 2014 Sep 2. Proc Natl Acad Sci U S A. 2014. PMID: 25197078 Free PMC article. Clinical Trial.
-
HIV Susceptibility of human antigen-specific CD4 T cells in AIDS pathogenesis and vaccine response.Expert Rev Vaccines. 2016 Jun;15(6):709-17. doi: 10.1586/14760584.2016.1147354. Epub 2016 Feb 17. Expert Rev Vaccines. 2016. PMID: 26814372 Free PMC article. Review.
-
Short communication: enhancement of immunogenicity of replication-defective adenovirus-based human immunodeficiency virus vaccines in rhesus monkeys.AIDS Res Hum Retroviruses. 2011 Jun;27(6):681-6. doi: 10.1089/AID.2010.0210. Epub 2011 Jan 8. AIDS Res Hum Retroviruses. 2011. PMID: 21083437 Review.
Cited by
-
A new adenovirus based vaccine vector expressing an Eimeria tenella derived TLR agonist improves cellular immune responses to an antigenic target.PLoS One. 2010 Mar 8;5(3):e9579. doi: 10.1371/journal.pone.0009579. PLoS One. 2010. PMID: 20221448 Free PMC article.
-
Pre-existing adenovirus immunity modifies a complex mixed Th1 and Th2 cytokine response to an Ad5/HIV-1 vaccine candidate in humans.PLoS One. 2011 Apr 13;6(4):e18526. doi: 10.1371/journal.pone.0018526. PLoS One. 2011. PMID: 21533229 Free PMC article.
-
Preexisting adenovirus seropositivity is not associated with increased HIV-1 acquisition in three HIV-1 vaccine efficacy trials.J Infect Dis. 2012 Jun 15;205(12):1806-10. doi: 10.1093/infdis/jis285. Epub 2012 Apr 5. J Infect Dis. 2012. PMID: 22492863 Free PMC article.
-
Novel vaccine vectors for HIV-1.Nat Rev Microbiol. 2014 Nov;12(11):765-71. doi: 10.1038/nrmicro3360. Epub 2014 Oct 8. Nat Rev Microbiol. 2014. PMID: 25296195 Free PMC article. Review.
-
Mucosal trafficking of vector-specific CD4+ T lymphocytes following vaccination of rhesus monkeys with adenovirus serotype 5.J Virol. 2010 Oct;84(19):9810-6. doi: 10.1128/JVI.01157-10. Epub 2010 Aug 4. J Virol. 2010. PMID: 20686023 Free PMC article.
References
Publication types
MeSH terms
Substances
Grants and funding
LinkOut - more resources
Full Text Sources
Other Literature Sources
Medical
Research Materials

