. 2009 Sep;29(18):5168-80.
doi: 10.1128/MCB.00482-09. Epub 2009 Jul 20.

GATA-2 reinforces megakaryocyte development in the absence of GATA-1

Affiliations

GATA-2 reinforces megakaryocyte development in the absence of GATA-1

Zan Huang et al. Mol Cell Biol. 2009 Sep.

Abstract

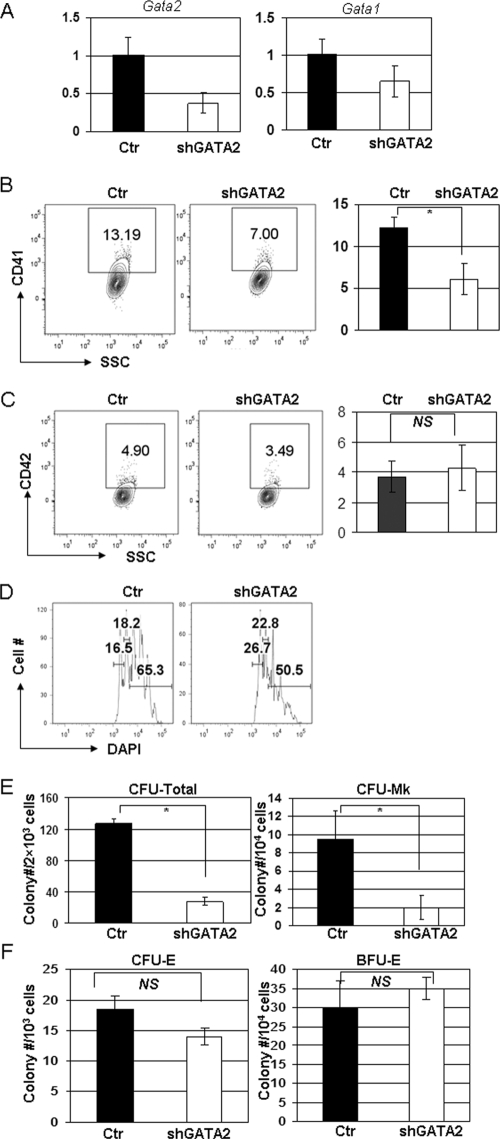
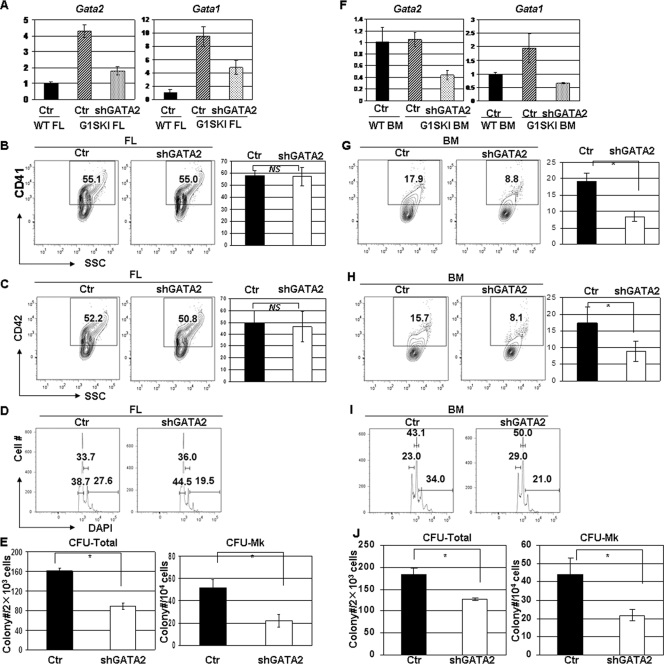
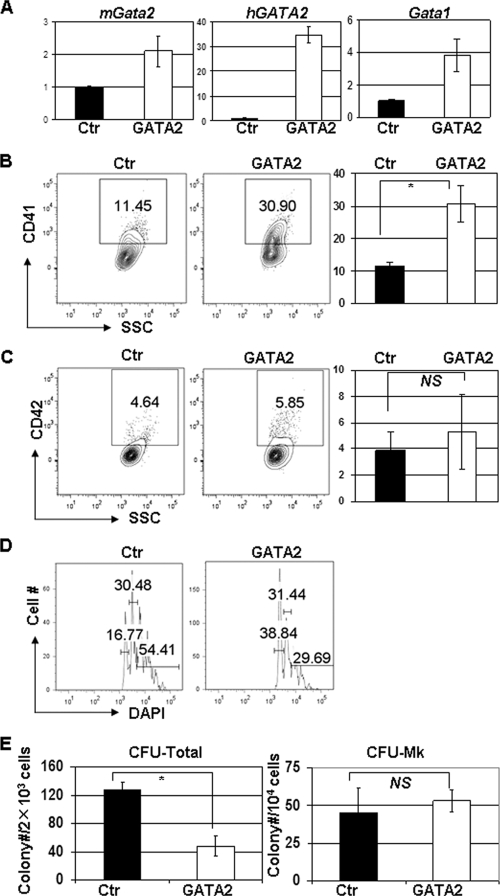
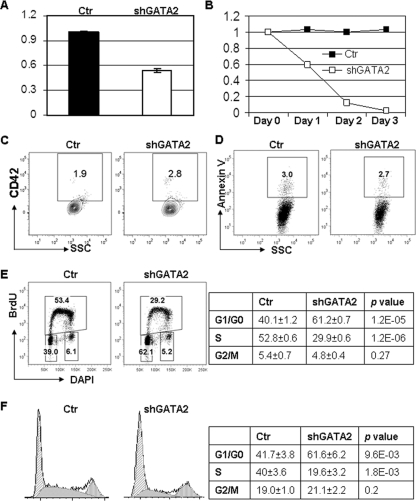
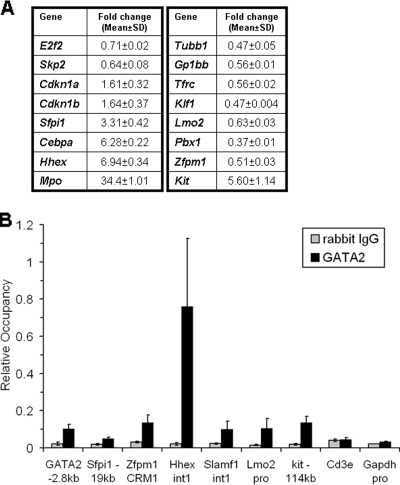
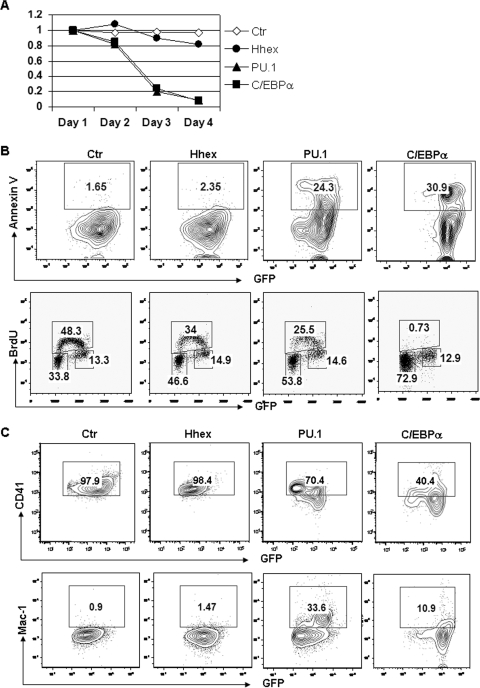
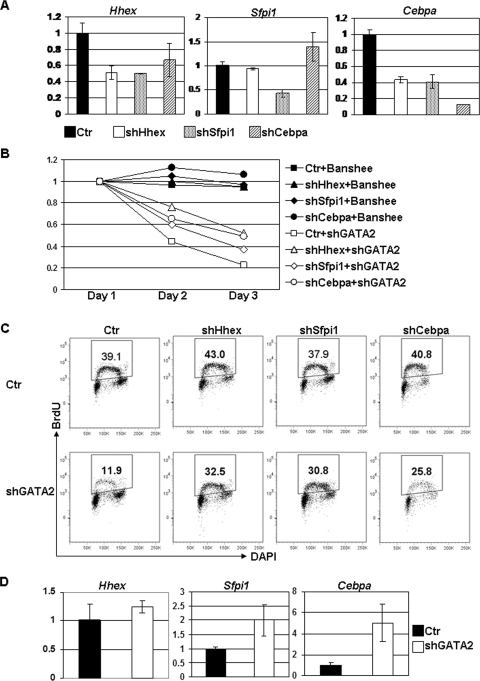
GATA-2 is an essential transcription factor that regulates multiple aspects of hematopoiesis. Dysregulation of GATA-2 is a hallmark of acute megakaryoblastic leukemia in children with Down syndrome, a malignancy that is defined by the combination of trisomy 21 and a GATA1 mutation. Here, we show that GATA-2 is required for normal megakaryocyte development as well as aberrant megakaryopoiesis in Gata1 mutant cells. Furthermore, we demonstrate that GATA-2 indirectly controls cell cycle progression in GATA-1-deficient megakaryocytes. Genome-wide microarray analysis and chromatin immunoprecipitation studies revealed that GATA-2 regulates a wide set of genes, including cell cycle regulators and megakaryocyte-specific genes. Surprisingly, GATA-2 also negatively regulates the expression of crucial myeloid transcription factors, such as Sfpi1 and Cebpa. In the absence of GATA-1, GATA-2 prevents induction of a latent myeloid gene expression program. Thus, GATA-2 contributes to cell cycle progression and the maintenance of megakaryocyte identity of GATA-1-deficient cells, including GATA-1s-expressing fetal megakaryocyte progenitors. Moreover, our data reveal that overexpression of GATA-2 facilitates aberrant megakaryopoiesis.


Figures

FIG. 1.
FIG. 1.
Downregulation of GATA-2 impairs megakaryopoiesis in WT bone marrow cells (A) GATA-1 and GATA-2 expression in WT lin bone marrow cells transduced with a retroviral vector harboring a short hairpin RNA against the mouse Gata2 gene (shGATA-2) or the control vector (Ctr) were detected by qRT-PCR. Results were normalized to those for control WT cultures. (B and C) Percentages of CD41-positive (B) and CD42-positive (C) cells in control or shGATA-2 cultures were determined by flow cytometry. Means ± standard deviations for three experiments are shown to the right of the representative flow plots. (D) DNA content of the infected cells was evaluated by DAPI staining. Percentages of 2N, 4N, and ≥8N populations are shown. Data are representative of three independent experiments. (E) Numbers of total colonies (CFU total) and pure megakaryocyte colonies (CFU-MK) formed after 7 days in methylcellulose cultures are shown. Means ± standard deviations for two independent experiments performed in triplicate are depicted. (F) Numbers of CFU-E and BFU-E colonies after knockdown of GATA-2. Means ± standard deviations for two independent experiments performed in triplicate are depicted. *, P < 0.05; NS, not significant.
FIG. 2.
FIG. 2.
Downregulation of GATA-2 impairs megakaryopoiesis in G1SKI fetal liver and bone marrow cells (A) GATA-1 and GATA-2 expression levels in G1SKI fetal liver (FL) progenitor cells infected with control or shGATA-2 retroviruses were measured by qRT-PCR and normalized to control WT FL cells (Ctr WT FL). (B and C) Percentages of CD41+ (B) and CD42+ (C) cells in control or shGATA-2 cultures were determined by flow cytometry. Means ± standard deviations for three experiments are shown to the right of the representative flow plots. (D) DNA content of the infected CD41+ cells was evaluated by DAPI staining. Percentages of 2N, 4N, and ≥8N populations are shown. Data are representative of three independent experiments. (E) The numbers of total (CFU total) and pure megakaryocyte colonies (CFU-MK) formed after 7 days in methylcellulose cultures are shown. Means ± standard deviations for three independent experiments performed in duplicate are depicted. (F) GATA-1 and GATA-2 expression levels in G1SKI bone marrow (BM) progenitor cells infected with control or shGATA-2 retroviruses were measured by qRT-PCR and normalized to control WT BM cells. (G and H) Percentages of CD41+ (G) and CD42+ (H) cells in control or shGATA-2 cultures were determined by flow cytometry. Means ± standard deviations for three experiments are shown to the right of the representative flow plots. (I) DNA content of the infected CD41+ cells was evaluated by DAPI staining. Percentages of 2N, 4N, and ≥8N populations are shown. Data are representative of three independent experiments. (J) The numbers of total colonies (CFU total) and pure megakaryocyte colonies (CFU-MK) formed after 7 days in methylcellulose cultures are shown. Means ± standard deviations for three independent experiments performed in duplicate are depicted. *, P < 0.05; NS, not significant.
FIG. 3.
FIG. 3.
GATA2 overexpression enhances megakaryocyte development in WT bone marrow cells. (A) Expression levels of GATA1 and GATA2 (hGATA2, human GATA2; mGata2, mouse GATA2) were measured in pBabe-GATA-2-transduced wild-type cells by qRT-PCR and normalized to the level found in pBabe-infected WT bone marrow cells (Ctr). (B and C) Percentages of CD41+ (B) and CD42+ (C) cells in cultures of pBabe-puro- or pBabe-GATA2-infected wild-type progenitors were determined by flow cytometry. Means ± standard deviations for three experiments are shown to the right of the representative flow plots. (D) DNA content of the infected cells was evaluated by DAPI staining. Percentages of 2N, 4N, and ≥8N populations are shown. Data are representative of three independent experiments. (E) The numbers of total colonies (CFU Total) and pure megakaryocyte colonies (CFU-MK) formed after 7 days in methylcellulose cultures are shown. Means ± standard deviations from two independent experiments performed in triplicate are depicted. *, P < 0.05; NS, not significant.
FIG. 4.
FIG. 4.
GATA2 overexpression promotes megakaryocyte development in G1SKI bone marrow cells (A) Expression levels of GATA1 and GATA2 were measured in pBabe-GATA-2-transduced bone marrow cells by qRT-PCR and normalized to the level of pBabe-infected G1SKI bone marrow cells (Ctr). (B and C) Percentages of CD41+ (B) and CD42+ (C) cells in megakaryocyte liquid cultures were measured by staining and analyzed by flow cytometry. Means ± standard deviations for two experiments performed in duplicate are shown to the right of the representative flow plots. (D) DNA content of the infected cells was evaluated by DAPI staining. Percentages of 2N, 4N, and ≥8N populations are shown. Data are representative of three independent experiments. (E) The numbers of total colonnes (CFU total) and pure megakaryocyte colonies (CFU-MK) formed after 7 days in methylcellulose cultures are shown. Means ± standard deviations from two independent experiments performed in duplicates are depicted. *, P < 0.05; NS, not significant.
FIG. 5.
FIG. 5.
GATA-2 is required for G1ME cell proliferation. (A) Downregulation of GATA-2 expression in GFP+ G1ME cells transduced with retroviruses harboring shGATA-2 or control vector was confirmed by qRT-PCR. (B) The percentage of transduced GFP+ cells was monitored by flow cytometry over 4 days and normalized to the day 0 value, which corresponded to the day of the last infection. (C and D) Day 2 transduced cells were evaluated for CD42 or annexin V staining by flow cytometry. Representative flow plots are shown. (E) Transduced cells were labeled with BrdU, stained with an anti-BrdU antibody, and analyzed by flow cytometry. Plots are representative of three experiments, with the means ± standard deviations displayed in the table (n = 3). (F) Transduced cells were fixed, permeabilized, and stained with DAPI, and the stages of the cell cycle were determined by the Dean-Jett-Fox model. The means ± standard deviations of the percentages of cells in the various stages of the cell cycle are depicted in the table (n = 3).
FIG. 6.
FIG. 6.
Validation of GATA-2 target genes by qRT-PCR and ChIP. (A) qRT-PCR was used to confirm changes in expression upon downregulation of GATA-2. (B) Enrichment of GATA-2 on various conserved regulatory elements was determined by qPCR of chromatin from G1ME cells. Binding is depicted as mean ± standard deviation values for at least two qPCR reactions from three independent ChIP experiments.
FIG. 7.
FIG. 7.
Overexpression of Hhex, PU.1, or C/EBPα causes cell cycle arrest in G1ME cells. (A) G1ME cells were transduced by MIGR1, Hhex, PU.1, or C/EBPα. The percentages of transduced cells were measured through detecting GFP+ cells by flow cytometry and normalized to the day 1 value. (B) The apoptotic cells were measured by detecting annexin V and analyzed by flow cytometry. The transduced cells were further labeled with BrdU. The labeled cells were measured by staining for BrdU. The cell cycle profile was analyzed by flow cytometry. (C) The expression levels of CD41 and Mac-1 in transduced cells were measured by surface staining with specific antibodies and analysis by flow cytometry.
FIG. 8.
FIG. 8.
Restoration of cell cycle arrest by downregulation of Hhex, PU.1, and C/EBPα in G1ME cells. (A) G1ME cells were transduced with control lentivirus (Ctr) or lentivirus expressing short hairpin specific to Hhex (shHhex), PU.1 (shSfpi1), or C/EBPα (shCebpa) and selected with puromycin. The downregulation of each gene were confirmed by qPCR. (B) The transduced cells were further infected by control retrovirus expressing GFP alone (Banshee) or retrovirus expressing both GFP and shGATA-2. The percentages of infected cells were monitored by flow cytometry during the following 3 days and normalized to values for day 1. (C) The double-transduced cells were labeled with BrdU on day 2. The labeled cells were measured by staining with antibody specific for BrdU and analyzed by flow cytometry. A gate was set up for GFP+ cells. (D) Progenitor cells from G1SKI fetal liver were transduced with shGATA-2 and selected by puromycin. The expression levels of Hhex, Sfpi1, and Cebpa were confirmed by qPCR. Data are representative of two independent experiments with similar results.

Similar articles

Cited by

References

    1. Bourquin, J. P., A. Subramanian, C. Langebrake, D. Reinhardt, O. Bernard, P. Ballerini, A. Baruchel, H. Cave, N. Dastugue, H. Hasle, G. L. Kaspers, M. Lessard, L. Michaux, P. Vyas, E. van Wering, C. M. Zwaan, T. R. Golub, and S. H. Orkin. 2006. Identification of distinct molecular phenotypes in acute megakaryoblastic leukemia by gene expression profiling. Proc. Natl. Acad. Sci. USA 1033339-3344. - PMC - PubMed
    1. Briegel, K., K. C. Lim, C. Plank, H. Beug, J. D. Engel, and M. Zenke. 1993. Ectopic expression of a conditional GATA-2/estrogen receptor chimera arrests erythroid differentiation in a hormone-dependent manner. Genes Dev. 71097-1109. - PubMed
    1. Cantor, A. B. 2005. GATA transcription factors in hematologic disease. Int. J. Hematol. 81378-384. - PubMed
    1. Cantor, A. B., H. Iwasaki, Y. Arinobu, T. B. Moran, H. Shigematsu, M. R. Sullivan, K. Akashi, and S. H. Orkin. 2008. Antagonism of FOG-1 and GATA factors in fate choice for the mast cell lineage. J. Exp. Med. 205611-624. - PMC - PubMed
    1. Chang, A. N., A. B. Cantor, Y. Fujiwara, M. B. Lodish, S. Droho, J. D. Crispino, and S. H. Orkin. 2002. GATA-factor dependence of the multitype zinc-finger protein FOG-1 for its essential role in megakaryopoiesis. Proc. Natl. Acad. Sci. USA 999237-9242. - PMC - PubMed

Publication types

MeSH terms