

Signed weighted gene co-expression network analysis of transcriptional regulation in murine embryonic stem cells
- PMID: 19619308
- PMCID: PMC2727539
- DOI: 10.1186/1471-2164-10-327
Signed weighted gene co-expression network analysis of transcriptional regulation in murine embryonic stem cells
Abstract
Background: Recent work has revealed that a core group of transcription factors (TFs) regulates the key characteristics of embryonic stem (ES) cells: pluripotency and self-renewal. Current efforts focus on identifying genes that play important roles in maintaining pluripotency and self-renewal in ES cells and aim to understand the interactions among these genes. To that end, we investigated the use of unsigned and signed network analysis to identify pluripotency and differentiation related genes.
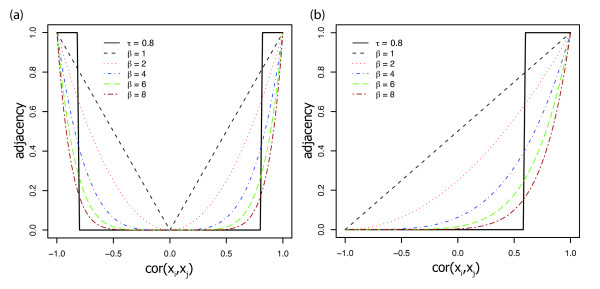
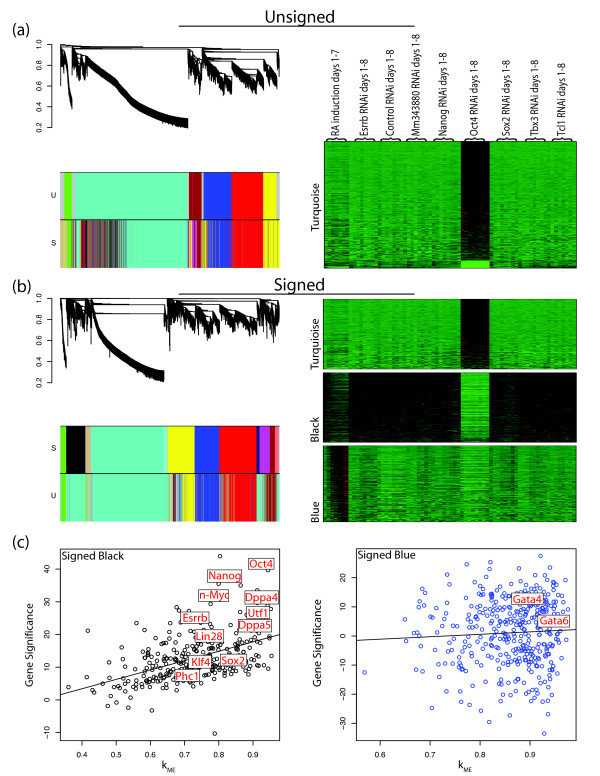
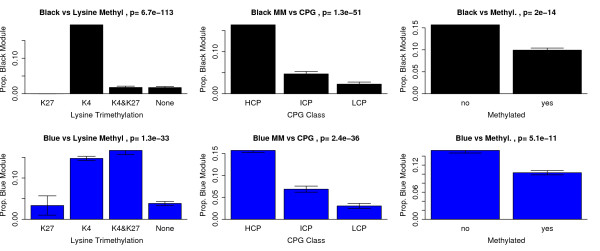
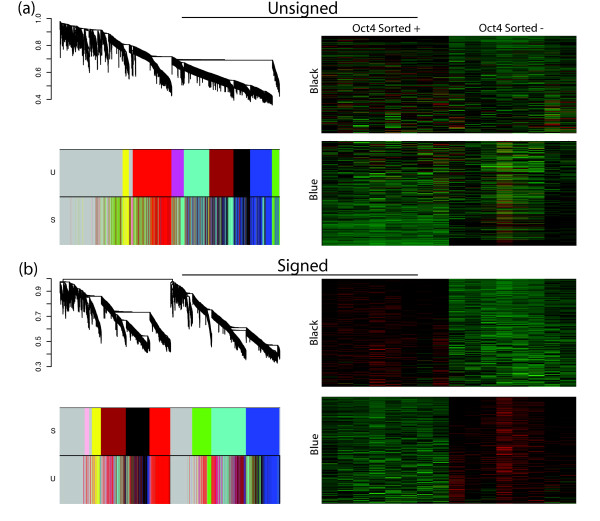
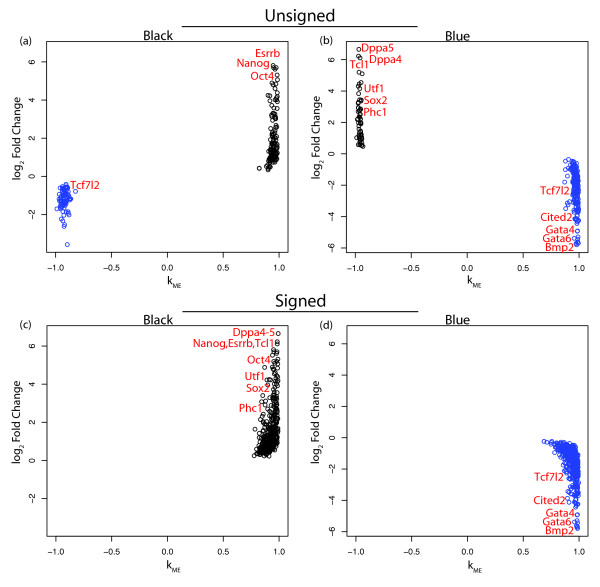
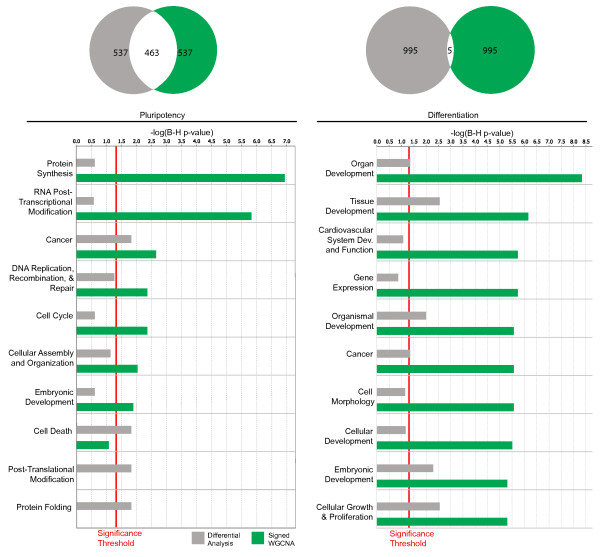
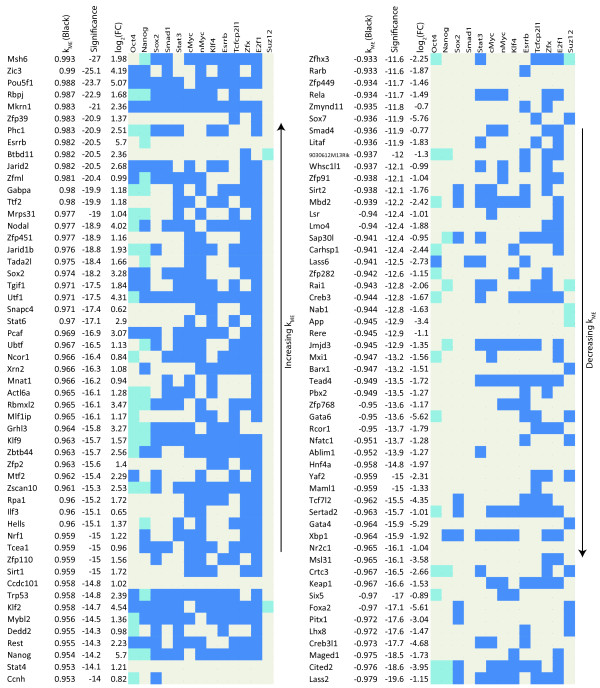
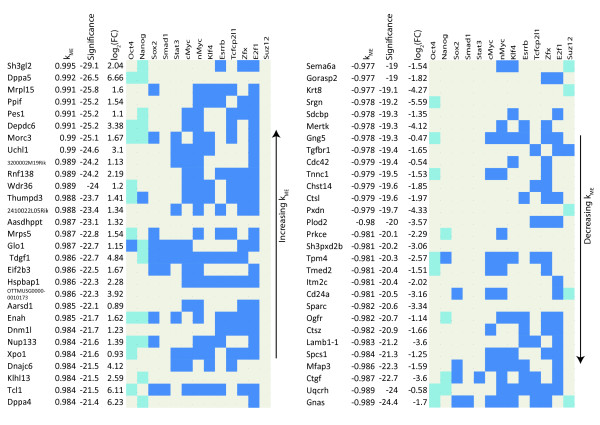
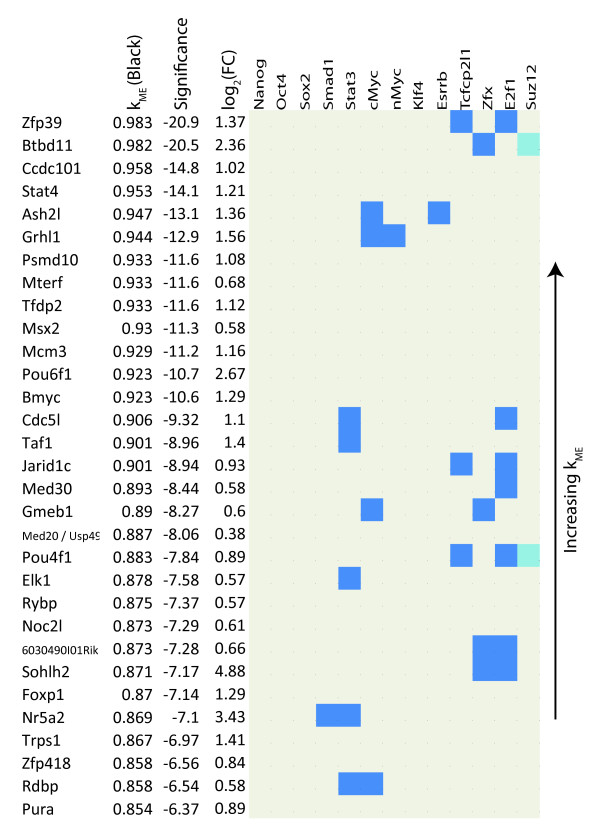
Results: We show that signed networks provide a better systems level understanding of the regulatory mechanisms of ES cells than unsigned networks, using two independent murine ES cell expression data sets. Specifically, using signed weighted gene co-expression network analysis (WGCNA), we found a pluripotency module and a differentiation module, which are not identified in unsigned networks. We confirmed the importance of these modules by incorporating genome-wide TF binding data for key ES cell regulators. Interestingly, we find that the pluripotency module is enriched with genes related to DNA damage repair and mitochondrial function in addition to transcriptional regulation. Using a connectivity measure of module membership, we not only identify known regulators of ES cells but also show that Mrpl15, Msh6, Nrf1, Nup133, Ppif, Rbpj, Sh3gl2, and Zfp39, among other genes, have important roles in maintaining ES cell pluripotency and self-renewal. We also report highly significant relationships between module membership and epigenetic modifications (histone modifications and promoter CpG methylation status), which are known to play a role in controlling gene expression during ES cell self-renewal and differentiation.
Conclusion: Our systems biologic re-analysis of gene expression, transcription factor binding, epigenetic and gene ontology data provides a novel integrative view of ES cell biology.
Figures
Similar articles
-
Stat3 and c-Myc genome-wide promoter occupancy in embryonic stem cells.PLoS One. 2008;3(12):e3932. doi: 10.1371/journal.pone.0003932. Epub 2008 Dec 11. PLoS One. 2008. PMID: 19079543 Free PMC article.
-
A regression analysis of gene expression in ES cells reveals two gene classes that are significantly different in epigenetic patterns.BMC Bioinformatics. 2011 Feb 15;12 Suppl 1(Suppl 1):S50. doi: 10.1186/1471-2105-12-S1-S50. BMC Bioinformatics. 2011. PMID: 21342583 Free PMC article.
-
SWI/SNF-Brg1 regulates self-renewal and occupies core pluripotency-related genes in embryonic stem cells.Stem Cells. 2009 Feb;27(2):317-28. doi: 10.1634/stemcells.2008-0710. Stem Cells. 2009. PMID: 19056910
-
Molecular mechanisms involved in self-renewal and pluripotency of embryonic stem cells.J Cell Physiol. 2007 May;211(2):279-86. doi: 10.1002/jcp.20978. J Cell Physiol. 2007. PMID: 17195167 Review.
-
Transcriptional regulation of the Oct4 gene, a master gene for pluripotency.Histol Histopathol. 2010 Mar;25(3):405-12. doi: 10.14670/HH-25.405. Histol Histopathol. 2010. PMID: 20054811 Free PMC article. Review.
Cited by
-
A joint transcriptional regulatory network and protein activity inference analysis identifies clinically associated master regulators for biliary atresia.Front Pediatr. 2022 Nov 11;10:1050326. doi: 10.3389/fped.2022.1050326. eCollection 2022. Front Pediatr. 2022. PMID: 36440333 Free PMC article.
-
Identification of differentially expressed genes in the endothelial precursor cells of patients with type 2 diabetes mellitus by bioinformatics analysis.Exp Ther Med. 2020 Jan;19(1):499-510. doi: 10.3892/etm.2019.8239. Epub 2019 Nov 22. Exp Ther Med. 2020. PMID: 31897097 Free PMC article.
-
Co-expression network analysis identified CDH11 in association with progression and prognosis in gastric cancer.Onco Targets Ther. 2018 Oct 2;11:6425-6436. doi: 10.2147/OTT.S176511. eCollection 2018. Onco Targets Ther. 2018. PMID: 30323620 Free PMC article.
-
Co-expression analysis of fetal weight-related genes in ovine skeletal muscle during mid and late fetal development stages.Int J Biol Sci. 2014 Sep 11;10(9):1039-50. doi: 10.7150/ijbs.9737. eCollection 2014. Int J Biol Sci. 2014. PMID: 25285036 Free PMC article.
-
Module Based Differential Coexpression Analysis Method for Type 2 Diabetes.Biomed Res Int. 2015;2015:836929. doi: 10.1155/2015/836929. Epub 2015 Aug 3. Biomed Res Int. 2015. PMID: 26339648 Free PMC article.
References
Publication types
MeSH terms
Substances
Grants and funding
LinkOut - more resources
Full Text Sources
Miscellaneous
