Detecting apoptotic cells and monitoring their clearance in the nematode Caenorhabditis elegans
- PMID: 19609769
- PMCID: PMC2901927
- DOI: 10.1007/978-1-60327-017-5_25
Detecting apoptotic cells and monitoring their clearance in the nematode Caenorhabditis elegans
Abstract
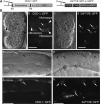
Apoptosis is a genetically controlled process of cell suicide that plays an important role in animal development and in maintaining homeostasis. The nematode Caenorhabditis elegans has proven to be an excellent model organism for studying the mechanisms controlling apoptosis and the subsequent clearance of apoptotic cells, aided with cell-biological and genetic tools. In particular, the transparent nature of worm bodies and eggshells makes C. elegans particularly amiable for live cell microscopy. Here we describe a few methods for identifying apoptotic cells in living C. elegans embryos and adults and for monitoring their clearance during embryonic development. These methods are based on Differential Interference Contrast microscopy and on fluorescence microscopy using GFP-based reporters.
Figures


Similar articles
-
Monitoring the clearance of apoptotic and necrotic cells in the nematode Caenorhabditis elegans.Methods Mol Biol. 2013;1004:183-202. doi: 10.1007/978-1-62703-383-1_14. Methods Mol Biol. 2013. PMID: 23733578 Free PMC article.
-
ccz-1 mediates the digestion of apoptotic corpses in C. elegans.J Cell Sci. 2010 Jun 15;123(Pt 12):2001-7. doi: 10.1242/jcs.062331. J Cell Sci. 2010. PMID: 20519582
-
A conserved role for SNX9-family members in the regulation of phagosome maturation during engulfment of apoptotic cells.PLoS One. 2011 Apr 8;6(4):e18325. doi: 10.1371/journal.pone.0018325. PLoS One. 2011. PMID: 21494661 Free PMC article.
-
Methods for detection and analysis of apoptosis signaling in the C. elegans germline.Methods. 2013 Jun 1;61(2):174-82. doi: 10.1016/j.ymeth.2013.04.022. Epub 2013 May 2. Methods. 2013. PMID: 23643851 Review.
-
Cleaning up the mess: cell corpse clearance in Caenorhabditis elegans.Curr Opin Cell Biol. 2012 Dec;24(6):881-8. doi: 10.1016/j.ceb.2012.11.002. Epub 2012 Dec 1. Curr Opin Cell Biol. 2012. PMID: 23206434 Review.
Cited by
-
Actomyosin-mediated apical constriction promotes physiological germ cell death in C. elegans.PLoS Biol. 2024 Aug 23;22(8):e3002775. doi: 10.1371/journal.pbio.3002775. eCollection 2024 Aug. PLoS Biol. 2024. PMID: 39178318 Free PMC article.
-
Binucleate germ cells in Caenorhabditis elegans are removed by physiological apoptosis.PLoS Genet. 2018 Jul 19;14(7):e1007417. doi: 10.1371/journal.pgen.1007417. eCollection 2018 Jul. PLoS Genet. 2018. PMID: 30024879 Free PMC article.
-
Expression of human Bcl-xL (Ser49) and (Ser62) mutants in Caenorhabditis elegans causes germline defects and aneuploidy.PLoS One. 2017 May 8;12(5):e0177413. doi: 10.1371/journal.pone.0177413. eCollection 2017. PLoS One. 2017. PMID: 28481930 Free PMC article.
-
Reproductive toxicity and meiotic dysfunction following exposure to the pesticides Maneb, Diazinon and Fenarimol.Toxicol Res (Camb). 2015 May;4(3):645-654. doi: 10.1039/C4TX00141A. Toxicol Res (Camb). 2015. PMID: 25984295 Free PMC article.
-
Autophagosomes fuse to phagosomes and facilitate the degradation of apoptotic cells in Caenorhabditis elegans.Elife. 2022 Jan 4;11:e72466. doi: 10.7554/eLife.72466. Elife. 2022. PMID: 34982028 Free PMC article.
References
-
- Savill J, Fadok V. Corpse clearance defines the meaning of cell death. Nature. 2000;407:784–8. - PubMed
-
- Jacobson MD, Weil M, Raff MC. Programmed cell death in animal development. Cell. 1997;88:347–54. - PubMed
-
- Metzstein MM, Stanfield GM, Horvitz HR. Genetics of programmed cell death in C. elegans: past, present and future. Trends Genet. 1998;14:410–6. - PubMed
-
- Zhou Z, Mangahas PM, Yu X. The genetics of hiding the corpse: engulfment and degradation of apoptotic cells in C. elegans and D. melanogaster. Curr Top Dev Biol. 2004;63:91–143. - PubMed
-
- Sulston JE, Horvitz HR. Post-embryonic cell lineages of the nematode, Caenorhabditis elegans. Dev Biol. 1977;56:110–56. - PubMed
Publication types
MeSH terms
Substances
Grants and funding
LinkOut - more resources
Full Text Sources

