

Hybrid in vivo FMT-CT imaging of protease activity in atherosclerosis with customized nanosensors
- PMID: 19608968
- PMCID: PMC2746251
- DOI: 10.1161/ATVBAHA.109.193086
Hybrid in vivo FMT-CT imaging of protease activity in atherosclerosis with customized nanosensors
Abstract
Objective: Proteases are emerging biomarkers of inflammatory diseases. In atherosclerosis, these enzymes are often secreted by inflammatory macrophages, digest the extracellular matrix of the fibrous cap, and destabilize atheromata. Protease function can be monitored with protease activatable imaging probes and quantitated in vivo by fluorescence molecular tomography (FMT). To address 2 major constraints currently associated with imaging of murine atherosclerosis (lack of highly sensitive probes and absence of anatomic information), we compared protease sensors (PS) of variable size and pharmacokinetics and coregistered FMT datasets with computed tomography (FMT-CT).
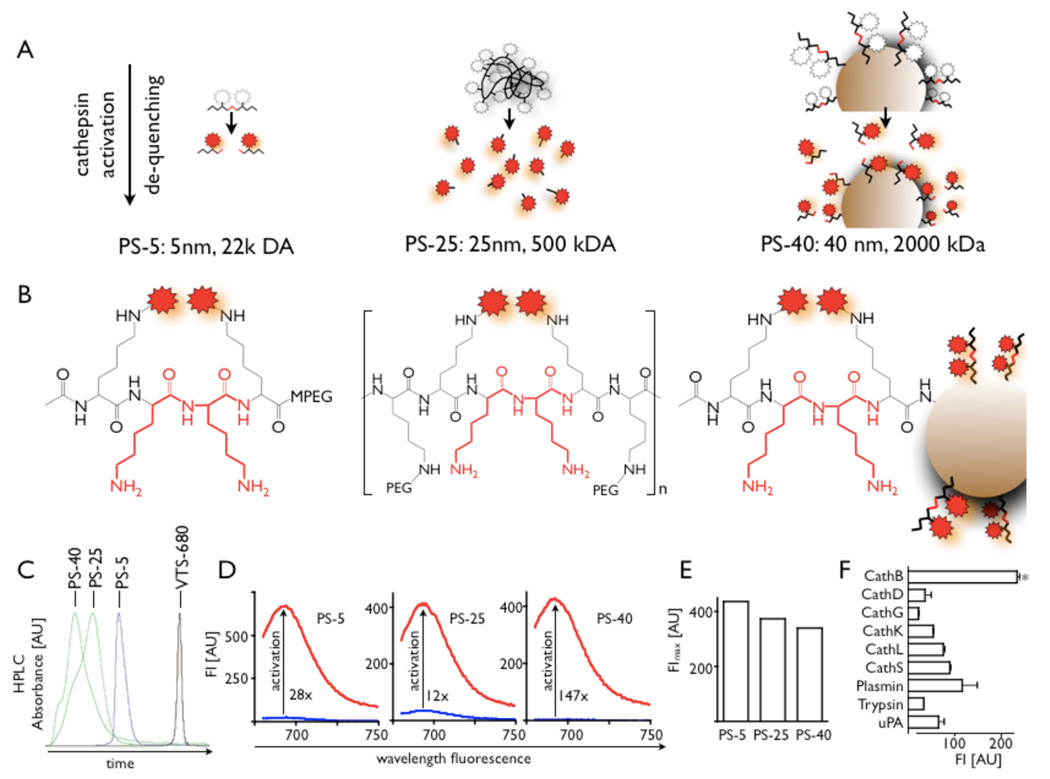
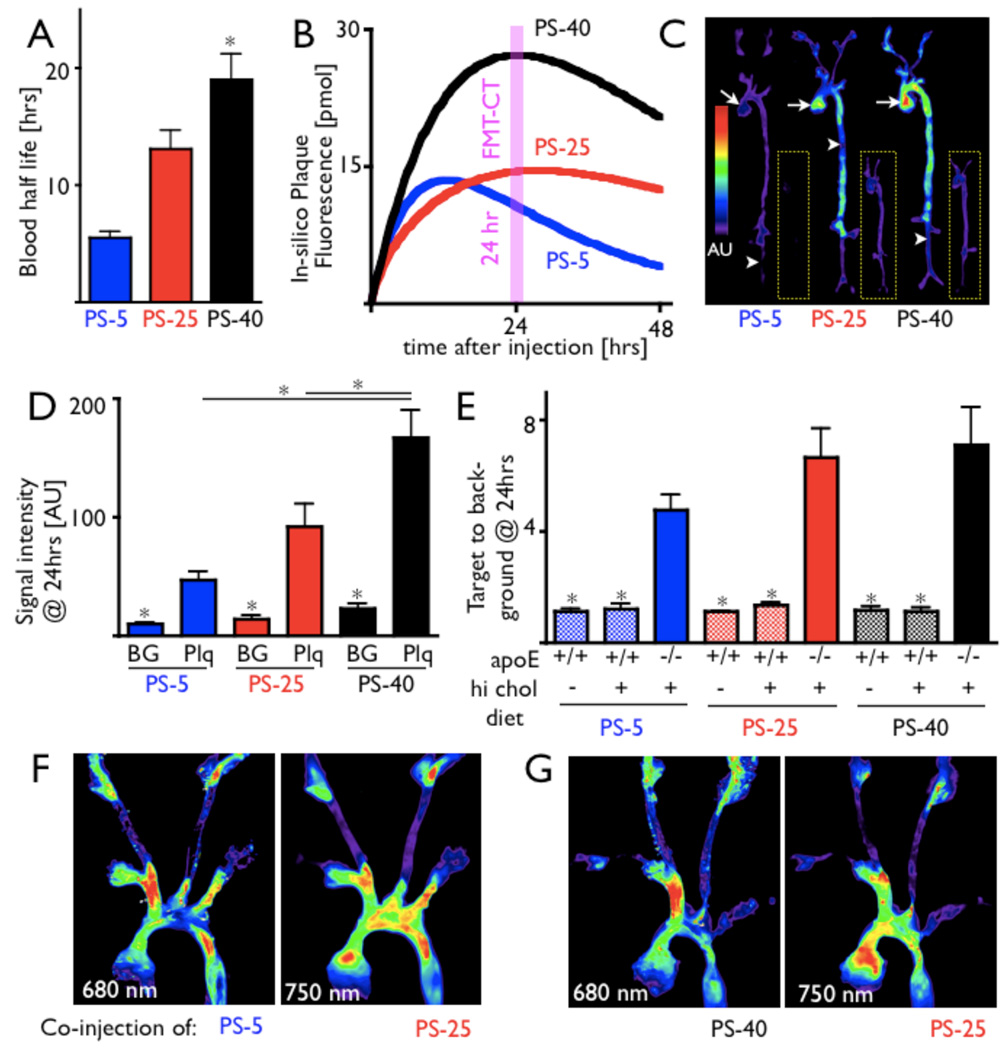
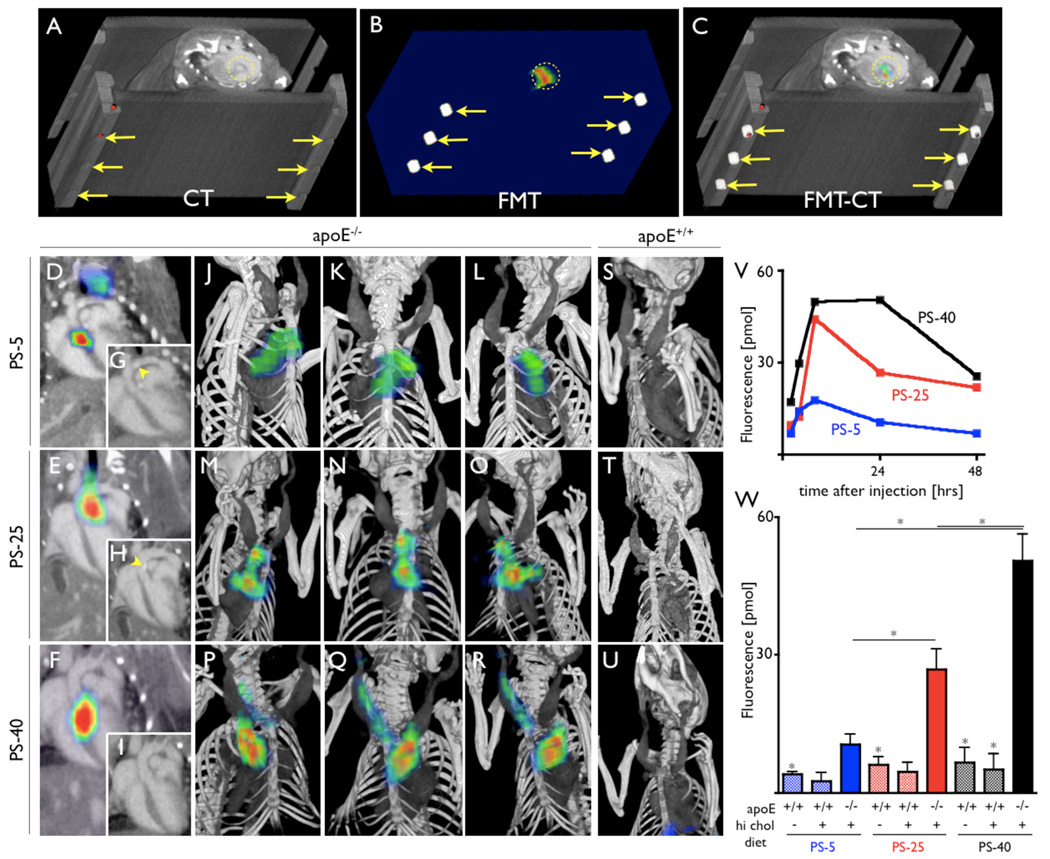
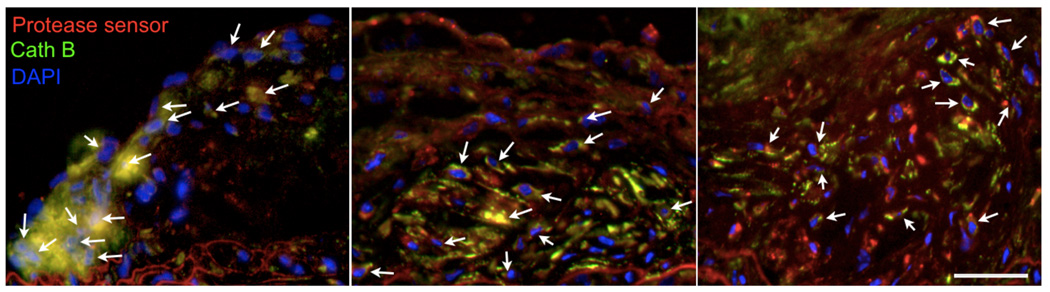
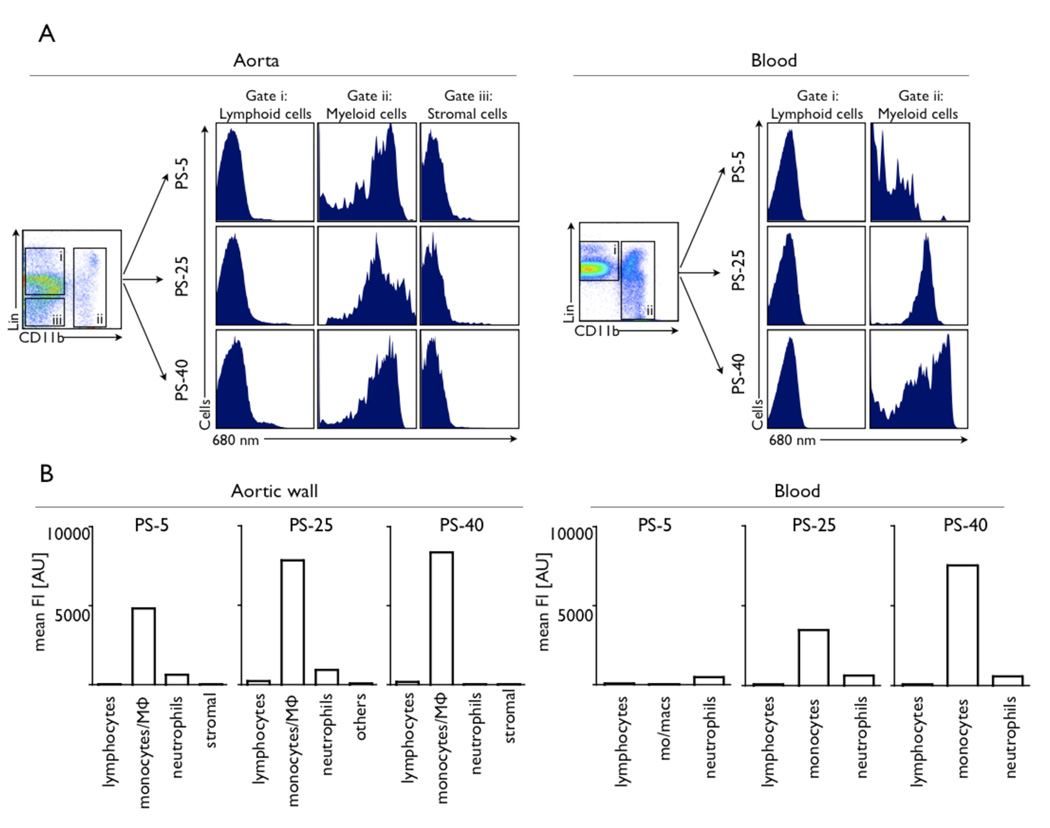
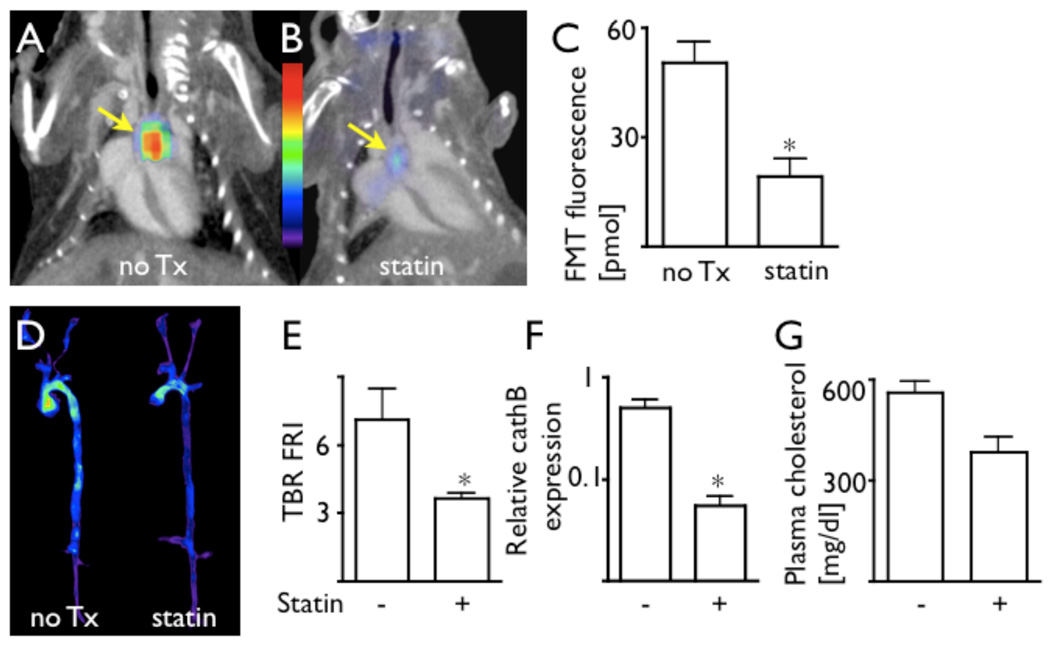
Methods and results: Coregistration of FMT and CT was achieved with a multimodal imaging cartridge containing fiducial markers detectable by both modalities. A high-resolution CT angiography protocol accurately localized fluorescence to the aortic root of atherosclerotic apoE(-/-) mice. To identify suitable sensors, we first modeled signal kinetics in-silico and then compared 3 probes with oligo-L-lysine cleavage sequences: PS-5, 5 nm in diameter containing 2 fluorochromes, PS-25, a 25-nm version with an elongated lysine chain and PS-40, a polymeric nanoparticle. Serial FMT-CT showed fastest kinetics for PS-5 but, surprisingly, highest fluorescence in lesions of the aortic root for PS-40. PS-40 robustly reported therapeutic effects of atorvastatin, corroborated by ex vivo imaging and qPCR for the model protease cathepsin B.
Conclusions: FMT-CT is a robust and observer-independent tool for noninvasive assessment of inflammatory murine atherosclerosis. Reporter-containing nanomaterials may have unique advantages over small molecule agents for in vivo imaging.
Conflict of interest statement
Kevin Groves and Millind Rajopadhye are employees of VisEn Medical. Ralph Weissleder is a consultant to VisEn Medical. Ralph Weissleder and Peter Waterman hold VisEn shares.
Figures
Similar articles
-
Dual channel optical tomographic imaging of leukocyte recruitment and protease activity in the healing myocardial infarct.Circ Res. 2007 Apr 27;100(8):1218-25. doi: 10.1161/01.RES.0000265064.46075.31. Epub 2007 Mar 22. Circ Res. 2007. PMID: 17379832
-
18F-4V for PET-CT imaging of VCAM-1 expression in atherosclerosis.JACC Cardiovasc Imaging. 2009 Oct;2(10):1213-22. doi: 10.1016/j.jcmg.2009.04.016. JACC Cardiovasc Imaging. 2009. PMID: 19833312 Free PMC article.
-
Nanoparticle PET-CT imaging of macrophages in inflammatory atherosclerosis.Circulation. 2008 Jan 22;117(3):379-87. doi: 10.1161/CIRCULATIONAHA.107.741181. Epub 2007 Dec 24. Circulation. 2008. PMID: 18158358 Free PMC article.
-
Use of fluorescent imaging to investigate pathological protease activity.Curr Opin Drug Discov Devel. 2008 Sep;11(5):708-16. Curr Opin Drug Discov Devel. 2008. PMID: 18729022 Review.
-
High-density lipoprotein-based contrast agents for multimodal imaging of atherosclerosis.Arterioscler Thromb Vasc Biol. 2010 Feb;30(2):169-76. doi: 10.1161/ATVBAHA.108.179275. Epub 2009 Oct 8. Arterioscler Thromb Vasc Biol. 2010. PMID: 19815819 Free PMC article. Review.
Cited by
-
Rapid monocyte kinetics in acute myocardial infarction are sustained by extramedullary monocytopoiesis.J Exp Med. 2012 Jan 16;209(1):123-37. doi: 10.1084/jem.20111009. Epub 2012 Jan 2. J Exp Med. 2012. PMID: 22213805 Free PMC article.
-
In vivo imaging in cancer.Cold Spring Harb Perspect Biol. 2010 Dec;2(12):a003848. doi: 10.1101/cshperspect.a003848. Epub 2010 Sep 22. Cold Spring Harb Perspect Biol. 2010. PMID: 20861158 Free PMC article. Review.
-
Multichannel imaging to quantify four classes of pharmacokinetic distribution in tumors.J Pharm Sci. 2014 Oct;103(10):3276-86. doi: 10.1002/jps.24086. Epub 2014 Jul 21. J Pharm Sci. 2014. PMID: 25048378 Free PMC article.
-
Imaging macrophage development and fate in atherosclerosis and myocardial infarction.Immunol Cell Biol. 2013 Apr;91(4):297-303. doi: 10.1038/icb.2012.72. Epub 2012 Dec 4. Immunol Cell Biol. 2013. PMID: 23207281 Free PMC article. Review.
-
Macrophage targeted theranostics as personalized nanomedicine strategies for inflammatory diseases.Theranostics. 2015 Jan 1;5(2):150-72. doi: 10.7150/thno.9476. eCollection 2015. Theranostics. 2015. PMID: 25553105 Free PMC article. Review.
References
-
- Libby P. Inflammation in atherosclerosis. Nature. 2002;420:868–874. - PubMed
-
- Sanz J, Fayad ZA. Imaging of atherosclerotic cardiovascular disease. Nature. 2008;451:953–957. - PubMed
-
- Falk E, Shah PK, Fuster V. Coronary plaque disruption. Circulation. 1995;92:657–671. - PubMed
-
- Schafers M, Riemann B, Kopka K, Breyholz HJ, Wagner S, Schafers KP, Law MP, Schober O, Levkau B. Scintigraphic imaging of matrix metalloproteinase activity in the arterial wall in vivo. Circulation. 2004;109:2554–2559. - PubMed
Publication types
MeSH terms
Substances
Grants and funding
LinkOut - more resources
Full Text Sources
Other Literature Sources
Medical
Miscellaneous
