

doi: 10.1038/ng.416.
Epub 2009 Jul 13.
Variants in ZFHX3 are associated with atrial fibrillation in individuals of European ancestry
Affiliations
- PMID: 19597492
- PMCID: PMC2761746
- DOI: 10.1038/ng.416
Item in Clipboard
Variants in ZFHX3 are associated with atrial fibrillation in individuals of European ancestry
Nat Genet.
2009 Aug.
Abstract
We conducted meta-analyses of genome-wide association studies for atrial fibrillation (AF) in participants from five community-based cohorts. Meta-analyses of 896 prevalent (15,768 referents) and 2,517 incident (21,337 referents) AF cases identified a new locus for AF (ZFHX3, rs2106261, risk ratio RR = 1.19; P = 2.3 x 10(-7)). We replicated this association in an independent cohort from the German AF Network (odds ratio = 1.44; P = 1.6 x 10(-11); combined RR = 1.25; combined P = 1.8 x 10(-15)).
Conflict of interest statement
Aravinda Chakravarti is a paid member of the Scientific Advisory Board of Affymetrix, a role that is managed by the Committee on Conflict of Interest of the Johns Hopkins University School of Medicine.
Figures
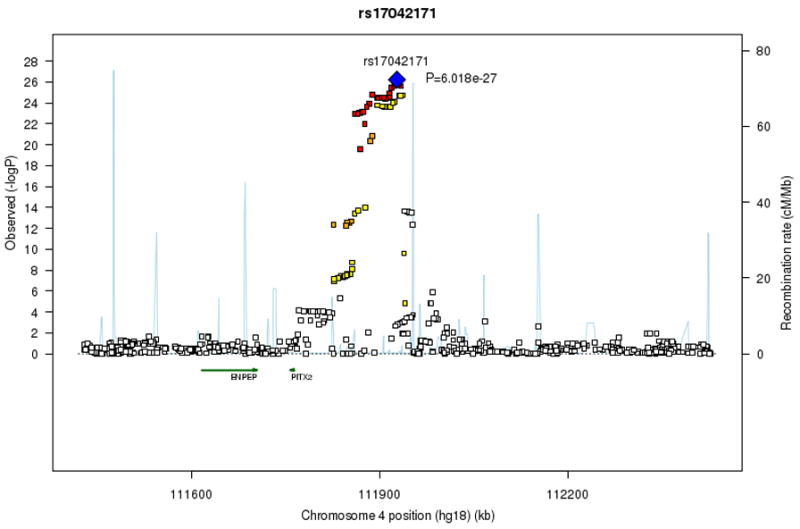
At each SNP location (genomic position, NCBI Build 36) we plot the log10
P value from combined analysis of incident and prevalent AF. Symbol colors indicate the strength of linkage disequilibrium derived from CEU HapMap build 22: strong (red, r2≥0.8) moderate (orange, 0.5≤r2<0.8) weak (yellow, 0.20≤r2<0.5) and low (white, r2<0.2). Estimated recombination rates are represented by pale blue lines and gene annotations by dark green arrows.
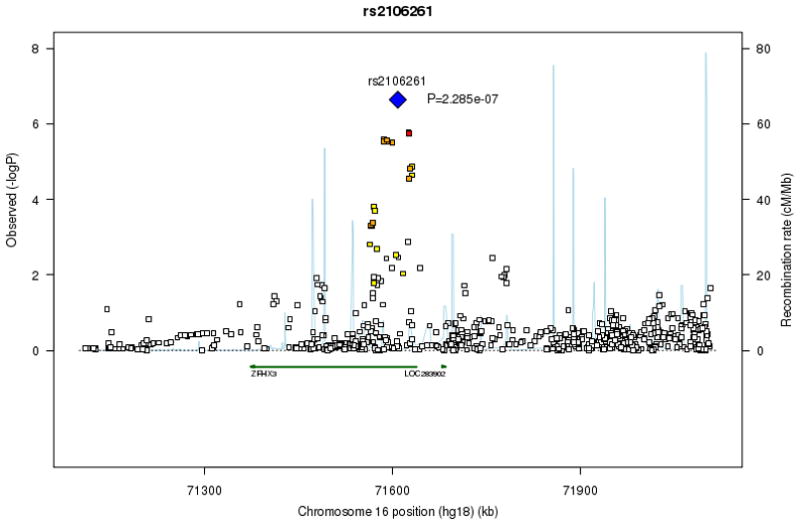
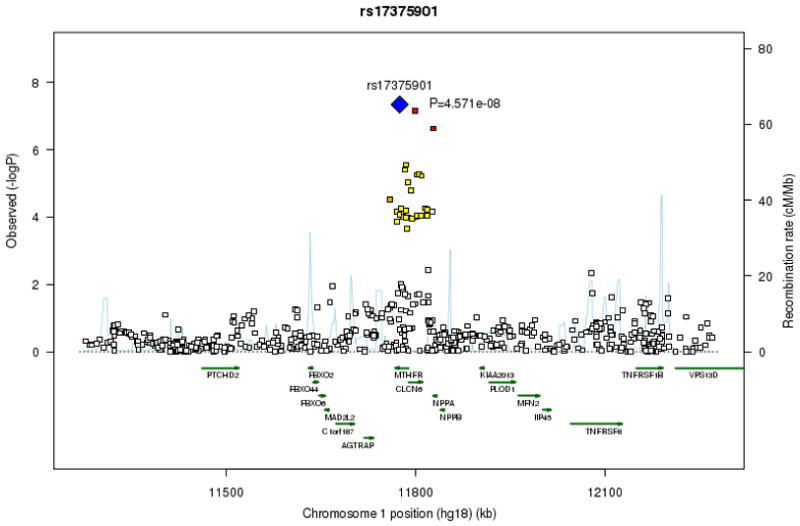
Similar articles
-
A sequence variant in ZFHX3 on 16q22 associates with atrial fibrillation and ischemic stroke.Nat Genet. 2009 Aug;41(8):876-8. doi: 10.1038/ng.417. Epub 2009 Jul 13. Nat Genet. 2009. PMID: 19597491 Free PMC article.
-
Significant association of SNP rs2106261 in the ZFHX3 gene with atrial fibrillation in a Chinese Han GeneID population.Hum Genet. 2011 Mar;129(3):239-46. doi: 10.1007/s00439-010-0912-6. Epub 2010 Nov 25. Hum Genet. 2011. PMID: 21107608 Free PMC article.
-
Maintenance of low inflammation level by the ZFHX3 SNP rs2106261 minor allele contributes to reduced atrial fibrillation recurrence after pulmonary vein isolation.PLoS One. 2018 Sep 4;13(9):e0203281. doi: 10.1371/journal.pone.0203281. eCollection 2018. PLoS One. 2018. PMID: 30180182 Free PMC article.
-
PITX2-dependent gene regulation in atrial fibrillation and rhythm control.J Physiol. 2017 Jun 15;595(12):4019-4026. doi: 10.1113/JP273123. Epub 2017 Apr 25. J Physiol. 2017. PMID: 28217939 Free PMC article. Review.
-
Common variants for atrial fibrillation: results from genome-wide association studies.Hum Genet. 2012 Jan;131(1):33-9. doi: 10.1007/s00439-011-1052-3. Epub 2011 Jul 7. Hum Genet. 2012. PMID: 21735173 Review.
Cited by
-
Family history as a risk factor for recurrent hospitalization for lone atrial fibrillation: a nationwide family study in Sweden.BMC Cardiovasc Disord. 2012 Dec 10;12:121. doi: 10.1186/1471-2261-12-121. BMC Cardiovasc Disord. 2012. PMID: 23227964 Free PMC article.
-
Heterozygous deletion of Atbf1 by the Cre-loxP system in mice causes preweaning mortality.Genesis. 2012 Nov;50(11):819-27. doi: 10.1002/dvg.22041. Epub 2012 Jun 21. Genesis. 2012. PMID: 22644989 Free PMC article.
-
Repolarization recipes for atrial fibrillation: beyond single channel variants.J Am Coll Cardiol. 2012 Mar 13;59(11):1026-8. doi: 10.1016/j.jacc.2011.12.010. J Am Coll Cardiol. 2012. PMID: 22402075 Free PMC article. No abstract available.
-
Innovative approaches to atrial fibrillation prediction: should polygenic scores and machine learning be implemented in clinical practice?Europace. 2024 Aug 3;26(8):euae201. doi: 10.1093/europace/euae201. Europace. 2024. PMID: 39073570 Free PMC article. Review.
-
Myeloid Zfhx3 deficiency protects against hypercapnia-induced suppression of host defense against influenza A virus.JCI Insight. 2024 Jan 16;9(4):e170316. doi: 10.1172/jci.insight.170316. JCI Insight. 2024. PMID: 38227369 Free PMC article.
References
MeSH terms
Substances
Grants and funding
- N01 HC085081/HC/NHLBI NIH HHS/United States
- N01 HC055222/HC/NHLBI NIH HHS/United States
- N01HC55016/HL/NHLBI NIH HHS/United States
- N01 HC055021/HC/NHLBI NIH HHS/United States
- N01 HC055020/HC/NHLBI NIH HHS/United States
- N01 HC045133/HC/NHLBI NIH HHS/United States
- N01 HC055016/HC/NHLBI NIH HHS/United States
- M01 RR000425-30S1/RR/NCRR NIH HHS/United States
- N01HC55020/HL/NHLBI NIH HHS/United States
- R01 AG028321-01/AG/NIA NIH HHS/United States
- N01 HC055022/HC/NHLBI NIH HHS/United States
- N01 HC085086/HC/NHLBI NIH HHS/United States
- R01 HL059367-02/HL/NHLBI NIH HHS/United States
- P30 DK063491-05/DK/NIDDK NIH HHS/United States
- R01 NS017950/NS/NINDS NIH HHS/United States
- R01 HL088456-01/HL/NHLBI NIH HHS/United States
- N01AG12100/AG/NIA NIH HHS/United States
- T32 HL007575-23/HL/NHLBI NIH HHS/United States
- N01 AG012100/AG/NIA NIH HHS/United States
- N01HC55018/HL/NHLBI NIH HHS/United States
- UL1 RR025005/RR/NCRR NIH HHS/United States
- U01 HG004402-01/HG/NHGRI NIH HHS/United States
- R01 HL093328-01/HL/NHLBI NIH HHS/United States
- U01 HL080295/HL/NHLBI NIH HHS/United States
- N01 HC075150/HC/NHLBI NIH HHS/United States
- R01 HL104156/HL/NHLBI NIH HHS/United States
- R01 HL092577/HL/NHLBI NIH HHS/United States
- R01 HL059367/HL/NHLBI NIH HHS/United States
- N01 HC015103/HC/NHLBI NIH HHS/United States
- M01 RR000069/RR/NCRR NIH HHS/United States
- N01 HC085083/HC/NHLBI NIH HHS/United States
- N01 HC055018/HC/NHLBI NIH HHS/United States
- P30 DK063491-06/DK/NIDDK NIH HHS/United States
- N01 HC025195/HC/NHLBI NIH HHS/United States
- T32 HL007575/HL/NHLBI NIH HHS/United States
- R01 HL086694/HL/NHLBI NIH HHS/United States
- U01 HL080295-01/HL/NHLBI NIH HHS/United States
- R01 HL080124-01/HL/NHLBI NIH HHS/United States
- N02 HL64278/HL/NHLBI NIH HHS/United States
- N01 HC085085/HC/NHLBI NIH HHS/United States
- R01 HL087652-01/HL/NHLBI NIH HHS/United States
- R01 HL087652/HL/NHLBI NIH HHS/United States
- R01 HL076784/HL/NHLBI NIH HHS/United States
- U01 HG004402/HG/NHGRI NIH HHS/United States
- N01HC55022/HL/NHLBI NIH HHS/United States
- N01HC55222/HL/NHLBI NIH HHS/United States
- R01 HL086694-01A1/HL/NHLBI NIH HHS/United States
- N01HC55015/HL/NHLBI NIH HHS/United States
- N01HC85086/HL/NHLBI NIH HHS/United States
- R01 HL088456/HL/NHLBI NIH HHS/United States
- R01 DK033651/DK/NIDDK NIH HHS/United States
- N01 HC055019/HC/NHLBI NIH HHS/United States
- P30 DK063491-039004/DK/NIDDK NIH HHS/United States
- N01 HC085082/HC/NHLBI NIH HHS/United States
- P30 DK063491/DK/NIDDK NIH HHS/United States
- N01 HC085080/HC/NHLBI NIH HHS/United States
- R01 HL086694-02/HL/NHLBI NIH HHS/United States
- P30 DK063491-029004/DK/NIDDK NIH HHS/United States
- N01 HC055015/HC/NHLBI NIH HHS/United States
- N01 HC085084/HC/NHLBI NIH HHS/United States
- N01HC55019/HL/NHLBI NIH HHS/United States
- R01 HL093328/HL/NHLBI NIH HHS/United States
- P30 DK063491-019004/DK/NIDDK NIH HHS/United States
- R01 NS017950-23/NS/NINDS NIH HHS/United States
- N01HC75150/HL/NHLBI NIH HHS/United States
- R01 HL092577-01A1/HL/NHLBI NIH HHS/United States
- N01HC25195/HL/NHLBI NIH HHS/United States
- R01 HL087641-01/HL/NHLBI NIH HHS/United States
- P30 DK063491-049004/DK/NIDDK NIH HHS/United States
- R01 HL080124/HL/NHLBI NIH HHS/United States
- N01HC55021/HL/NHLBI NIH HHS/United States
- R01 AG028321/AG/NIA NIH HHS/United States
- R01 HL087641/HL/NHLBI NIH HHS/United States
- N01HC85079/HL/NHLBI NIH HHS/United States
- N01 HC085079/HC/NHLBI NIH HHS/United States
- R01 HL076784-01/HL/NHLBI NIH HHS/United States
- N01 HC035129/HC/NHLBI NIH HHS/United States
LinkOut - more resources
Full Text Sources
Other Literature Sources
Medical
Molecular Biology Databases
