. 2009 Sep;83(18):9122-30.
doi: 10.1128/JVI.00639-09. Epub 2009 Jul 8.

Negative immune regulator Tim-3 is overexpressed on T cells in hepatitis C virus infection and its blockade rescues dysfunctional CD4+ and CD8+ T cells

Affiliations

Negative immune regulator Tim-3 is overexpressed on T cells in hepatitis C virus infection and its blockade rescues dysfunctional CD4+ and CD8+ T cells

Lucy Golden-Mason et al. J Virol. 2009 Sep.

Abstract

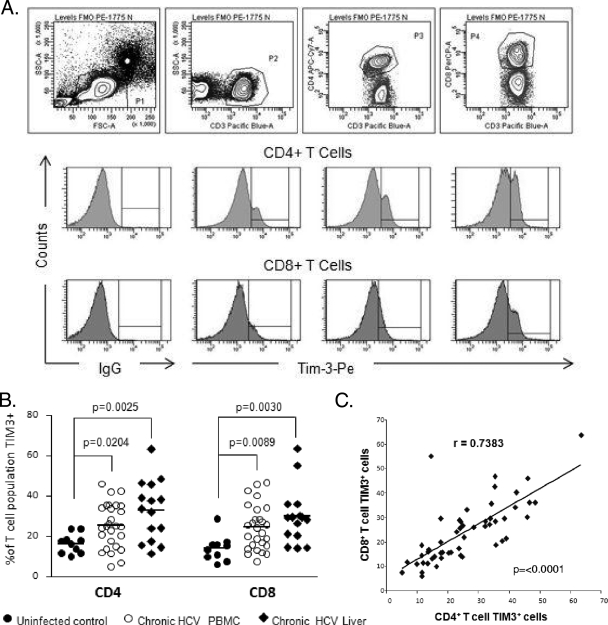
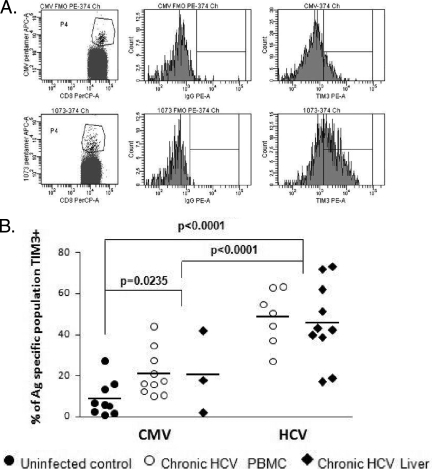
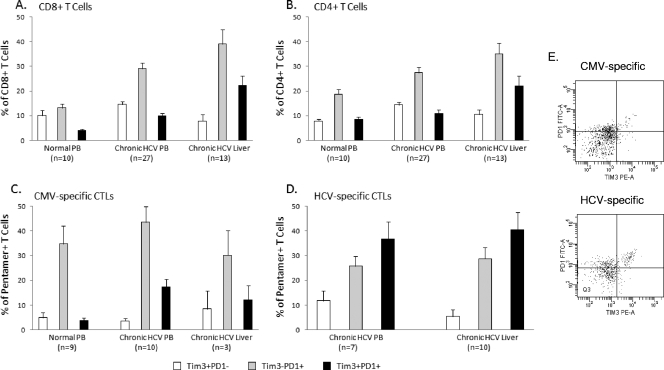
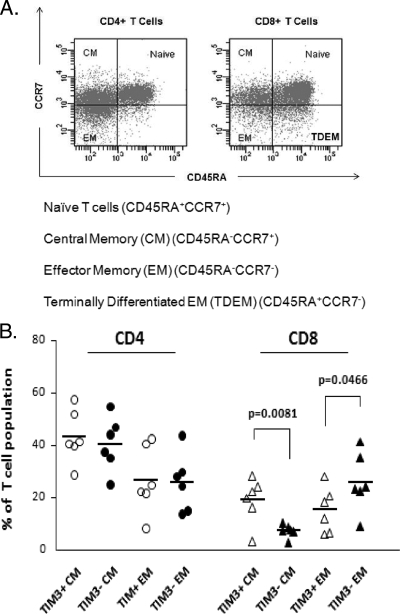
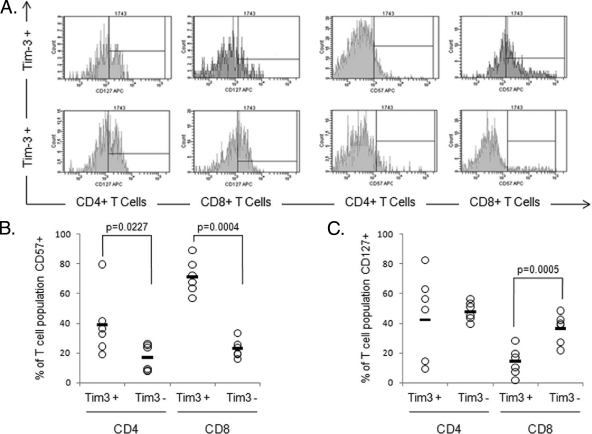
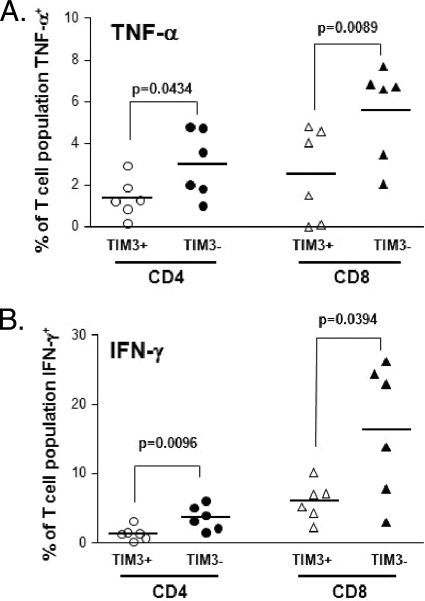
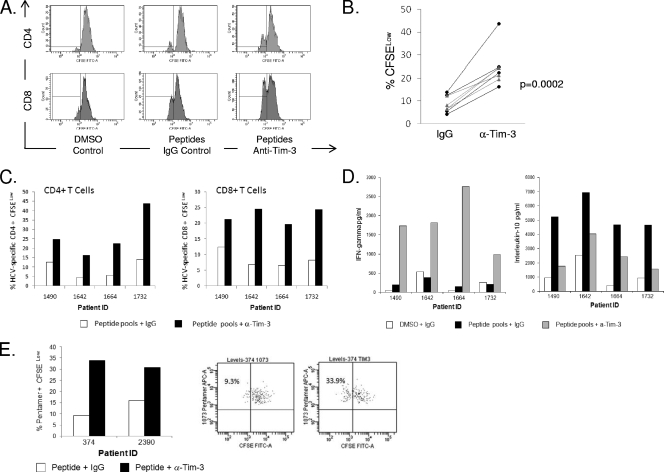
A number of emerging molecules and pathways have been implicated in mediating the T-cell exhaustion characteristic of chronic viral infection. Not all dysfunctional T cells express PD-1, nor are they all rescued by blockade of the PD-1/PD-1 ligand pathway. In this study, we characterize the expression of T-cell immunoglobulin and mucin domain-containing protein 3 (Tim-3) in chronic hepatitis C infection. For the first time, we found that Tim-3 expression is increased on CD4(+) and CD8(+) T cells in chronic hepatitis C virus (HCV) infection. The proportion of dually PD-1/Tim-3-expressing cells is greatest in liver-resident T cells, significantly more so in HCV-specific than in cytomegalovirus-specific cytotoxic T lymphocytes. Tim-3 expression correlates with a dysfunctional and senescent phenotype (CD127(low) CD57(high)), a central rather than effector memory profile (CD45RA(negative) CCR7(high)), and reduced Th1/Tc1 cytokine production. We also demonstrate the ability to enhance T-cell proliferation and gamma interferon production in response to HCV-specific antigens by blocking the Tim-3-Tim-3 ligand interaction. These findings have implications for the development of novel immunotherapeutic approaches to this common viral infection.


Figures

FIG. 1.
FIG. 1.
Tim-3 expression is increased on CD4+ and CD8+ T cells in chronic HCV infection. (A) PBMCs from HCV-infected (n = 27) and uninfected (n = 10) subjects, as well as HMNCs from chronic HCV infection patients (n = 15) were stained with antibodies against CD3, CD4, CD8, and Tim-3. The top panel shows the gating strategy for identifying CD4+ and CD8+ T-cell subsets. The middle and lower panels consist of representative flow cytometric histograms measuring Tim-3 expression on gated CD4+ and CD8+ T cells, respectively. Interval gates to determine the percentage of the T-cell subset expressing Tim-3 are set relative to the appropriate FMO control. (B) The frequency of Tim-3-expressing CD4+ and CD8+ T cells is increased in chronically HCV-infected subjects and highest in liver-derived T-cell subsets. Each symbol represents an individual patient, and the horizontal lines demonstrate the mean. (C) There is a direct positive correlation between the proportion of CD4+ and CD8+ T cells expressing Tim-3. Tim-3 expression on either CD4+ or CD8+ T cells did not correlate with the viral load (data not shown).
FIG. 2.
FIG. 2.
Tim-3 expression is increased on HCV-specific T cells. (A) Individuals who were shown to be positive for HLA A2 were screened for anti-CMV and anti-HCV responses using a panel of pentamers (as described in Materials and Methods) and assayed for Tim-3 expression. The plots shown are from one chronically HCV-infected subject who demonstrated positivity for anti-CMV, as well as anti-HCV responses. The top panel shows the anti-CMV T cells and expression of Tim-3 on this population relative to the FMO control. The bottom panel shows a higher frequency of Tim-3-positive HCV-specific T cells. (B) HCV-specific T cells in the liver and the periphery demonstrate a significantly higher frequency of Tim-3-positive cells than CMV-specific T cells. Remarkably, a higher proportion of CMV-specific T cells from chronic HCV infection patients express Tim-3 than anti-CMV T cells in uninfected controls. Each symbol represents an individual patient, and the horizontal lines demonstrate the mean.
FIG. 3.
FIG. 3.
Coexpression of PD-1 on Tim-3-positive T cells in chronic HCV infection. Coexpression of PD1 on Tim-3-positive bulk and antigen-specific T-cell populations was examined. Mean values are shown expressed as a percentage of the indicated population. (A) Total CD8+ T cells that coexpress Tim-3 and PD1 are rare in uninfected control blood. A significant increase is seen in the doubly positive population in peripheral CD8+ T cells in chronic HCV infection (P = 0.0074), which is further increased in the liver compartment (P = 0.0007). (B) A similar pattern is seen for CD4+ T cells with respect to the liver compartment (P = 0.0135); however, peripheral populations do not differ significantly from uninfected controls. (C) CMV-specific and (D) HCV-specific populations are shown (percentage of pentamer-positive cells). In the periphery, in chronic HCV infection, the proportion of Tim-3/PD1 doubly positive cells is increased on all antigen-specific CTLs independently of specificity; however, the proportion of doubly positive HCV-specific CTLs is significantly higher than CMV-specific and total CD8+ T cells in chronic infection (P = 0.0127). Within the liver compartment, an increase in the level of HCV-specific doubly positive cells compared to that in the peripheral blood was not observed. Error bars represent the standard error of the mean. (E) Representative flow plots of PD-1 and Tim-3 staining on antigen-specific cells from peripheral blood.
FIG. 4.
FIG. 4.
Tim-3positive CD8+ T-cell populations contain more central and less effector memory cells than their Tim-3negative counterparts. (A) Naïve, central memory (CM), and effector memory (EM) T-cell subsets can be defined by the pattern of expression of CD45RA and CCR7 as shown. In the CD8+ T-cell population, cells positive for CD4RA and not expressing CCR7 are thought to be terminally differentiated effector memory (TDEM) cells derived from the effector memory cell population which re-express this antigen. (B) CD4+ and CD8+ T cells were subdivided on the basis of positivity and negativity for Tim-3 expression. Tim-3-positive and Tim-3-negative CD4+/CD8+ T cells were analyzed for the expression of CD45RA and CCR7 to determine the relative maturation stages of these populations. A higher proportion of the Tim-3-positive CD8+ T cells demonstrated a central memory (CM) phenotype, while fewer demonstrated an effector memory phenotype than their Tim-3-negative counterparts. No difference was demonstrated for the TDEM population (data not shown). Each symbol represents an individual patient, and the horizontal lines demonstrate the mean. No differences in maturation phenotype were observed for the CD4+ T-cell subsets. Data points are shown for central and effector memory populations only.
FIG. 5.
FIG. 5.
Tim-3 expression identifies T cells with a dysfunctional phenotype. (A) CD4+ and CD8+ T cells were subdivided on the basis of positivity and negativity for Tim-3 expression. Tim-3-positive and Tim-3-negative CD4+/CD8+ T cells were analyzed for the coexpression of CD57 and CD127. PBMCs from six subjects were assayed, three uninfected controls and three chronic HCV infection patients. The representative flow cytometric histograms show expression of these cell surface antigens on CD4 and CD8+ T-cell subsets defined by Tim-3 expression. Interval gates to determine the percentage of the T-cell subset expressing Tim-3 are set relative to the appropriate FMO control. The phenotype of Tim-3+ T-cell subsets is consistent with a more exhausted phenotype. (B) The senescence marker CD57 is preferentially expressed on the Tim-3-positive subset of both CD4+ and CD8+ T cells. In particular for Tim-3+ CD8+ cells, there appears to be a shift in the entire population, suggesting that the entire population may be positive for CD57, albeit at a level below detection compared to isotype controls. (C) Decreased expression of the IL-7 receptor (CD127), a putative marker for functional T cells, was also demonstrated for Tim-3+ CD8+ T cells. Each symbol represents an individual patient, and the horizontal lines represent the mean.
FIG. 6.
FIG. 6.
Tim-3+ T cells produce less Th1/Tc1 cytokines. PBMCs from six subjects, three uninfected controls and three chronic HCV infection patients, were stimulated for 6 h with plate-bound anti-CD3 (5 μg/ml) and soluble anti-CD28 (3 μg/ml) antibodies in the presence of brefeldin A to inhibit cytokine secretion. Cell surface staining was carried out for CD3, CD4, CD8, and Tim-3, followed by intracellular staining for TNF-α, IFN-γ, and IL-2. Flow cytometric analysis was used to determine the proportions of the Tim-3-positive and -negative subsets of CD4+ and CD8+ T cells producing cytokines after brief stimulation. (A) Tim-3-positive CD4+ and CD8+ T-cell subsets produce less TNF-α than their Tim-3-negative counterparts. (B) A similar pattern is seen for IFN-γ production.
FIG. 7.
FIG. 7.
Blocking Tim-3 enhances HCV-specific proliferative responses for both CD4+ and CD8+ T cells. Four chronic HCV infection patients were chosen on the basis of their previously demonstrated ability to produce IFN-γ in response to HCV-specific peptide pools as assessed by ELISPOT assays (both CD4+ and CD8+ T cells). PBMCs were CFSE stained and cultured for 7 days with DMSO or appropriate HCV-specific peptide pools, and the effect of 10 μg/ml of IgG isotype control was compared to the effect of 10 μg/ml of anti-Tim-3 MAb (clone 1G5). A decrease in CFSE (% CFSELow cells) is indicative of proliferated cells. The HCV peptide pools used were as follows: for patient 1, p7, NS5B5, and NS5B4; for patient 2, E1B and NS2A; for patient 3, core (A and B), E1A, E1B, and NS5B5; for patient 4, NS37H, NS4A, and NS5B6 (the composition of the peptide pools is described fully in reference 20). (A) Representative flow plots of CFSE staining are shown for one individual patient, although cells do not appear to have undergone multiple rounds of proliferation. (B) The combined data from all four patients tested comparing the effect of anti-Tim-3 to that of the IgG control in the presence of antigen-specific stimulation is shown. The black dotted lines (with circles) represent CD4+ T cells, and the grey solid lines represent CD8+ T cells. (C) Proliferative responses are shown minus the DMSO control for four individual patients. (D) Supernatants from the proliferation assay were tested for levels of IFN-γ and IL-10. As shown, culture in the presence of the anti-Tim-3 antibody induced IFN-γ. A concomitant decrease in IL-10 was observed. (E) The high level of proliferated cells detected in the assays using peptide pools suggests that there may also be proliferation of non-antigen-specific cells in this assay, although the staining suggests that the cells have not undergone multiple rounds of division; therefore, we took a more conventional approach and tested the ability of the blocking antibody to induce proliferation of pentamer-positive cells.

Similar articles

Cited by

References

    1. Appay, V., P. R. Dunbar, M. Callan, P. Klenerman, G. M. A. Gillespie, L. Papagno, G. S. Ogg, A. King, F. Lechner, C. A. Spina, S. Little, D. V. Havlir, D. D. Richman, N. Gruener, G. Pape, A. Waters, P. Easterbrook, M. Salio, V. Cerundolo, A. J., McMichael, and S. L. Rowland-Jones. 2002. Memory CD8+ T cells vary in differentiation phenotype in different persistent virus infections. Nat. Med. 8:379-385. - PubMed
    1. Baran, J., D. Kowalczyk, M. Ozóg, and M. Zembala. 2001. Three-color flow cytometry detection of intracellular cytokines in peripheral blood mononuclear cells: comparative analysis of phorbol myristate acetate-ionomycin and phytohemagglutinin stimulation. Clin. Diagn. Lab. Immunol. 8:303-313. - PMC - PubMed
    1. Burton, J. R., Jr., J. Klarquist, K. Im, S. Smyk-Pearson, L. Golden-Mason, N. Castelblanco, N. Terrault, H. R. Rosen, and the Virahep-C Study Group. 2008. Prospective analysis of effector and regulatory CD4+ T cells in chronic HCV patients undergoing combination antiviral therapy. J. Hepatol. 49:329-338. - PubMed
    1. D'Souza, M., A. P. Fontenot, D. G. Mack, C. Lozupone, S. Dillon, A. Meditz, C. C. Wilson, E. Connick, and B. E. Palmer. 2007. Programmed death 1 expression on HIV-specific CD4+ T cells is driven by viral replication and associated with T cell dysfunction. J. Immunol. 179:1979-1987. - PubMed
    1. Golden-Mason, L., J. R. Burton, Jr., N. Castelblanco, J. Klarquist, S. Benlloch, C. Wang, and H. R. Rosen. 2006. Loss of IL-7 receptor alpha-chain (CD127) expression in acute HCV infection associated with viral persistence. Hepatology 44:1098-1109. - PubMed

Publication types