

Murine B cell response to TLR7 ligands depends on an IFN-beta feedback loop
- PMID: 19587008
- PMCID: PMC2929820
- DOI: 10.4049/jimmunol.0803899
Murine B cell response to TLR7 ligands depends on an IFN-beta feedback loop
Abstract
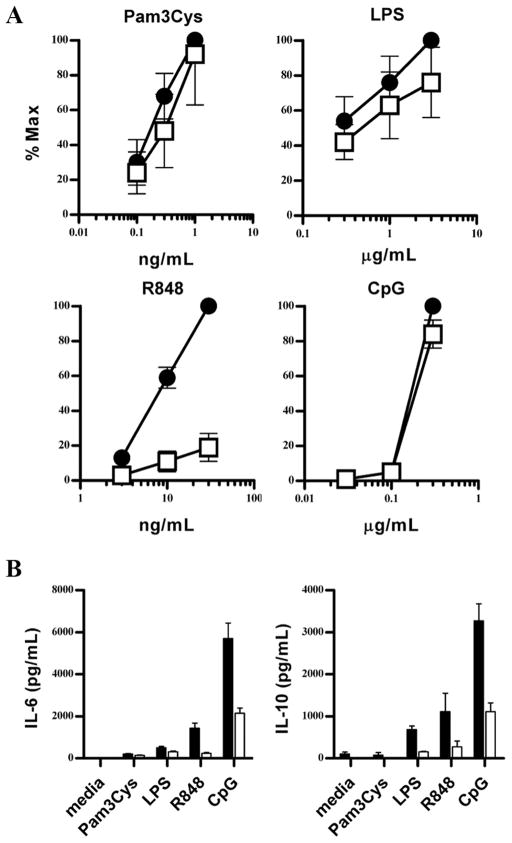
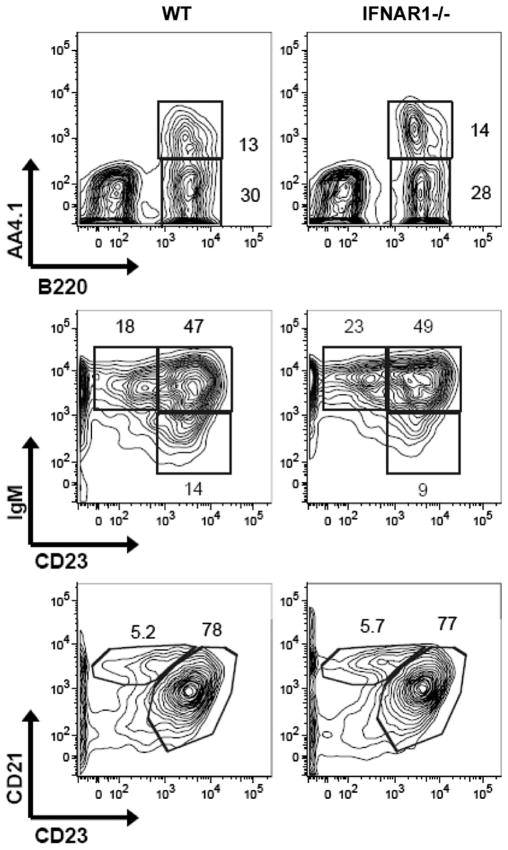
Type I IFNs play an important, yet poorly characterized, role in systemic lupus erythematosus. To better understand the interplay between type I IFNs and the activation of autoreactive B cells, we evaluated the effect of type I IFN receptor (IFNAR) deficiency in murine B cell responses to common TLR ligands. In comparison to wild-type B cells, TLR7-stimulated IFNAR(-/-) B cells proliferated significantly less well and did not up-regulate costimulatory molecules. By contrast, IFNAR1(-/-) B cells did not produce cytokines, but did proliferate and up-regulate activation markers in response to other TLR ligands. These defects were not due to a difference in the distribution of B cell populations or a failure to produce a soluble factor other than a type I IFN. Instead, the compromised response pattern reflected the disruption of an IFN-beta feedback loop and constitutively low expression of TLR7 in the IFNAR1(-/-) B cells. These results highlight subtle differences in the IFN dependence of TLR7 responses compared with other TLR-mediated B cell responses.
Conflict of interest statement
The authors have no financial conflict of interest.
Figures
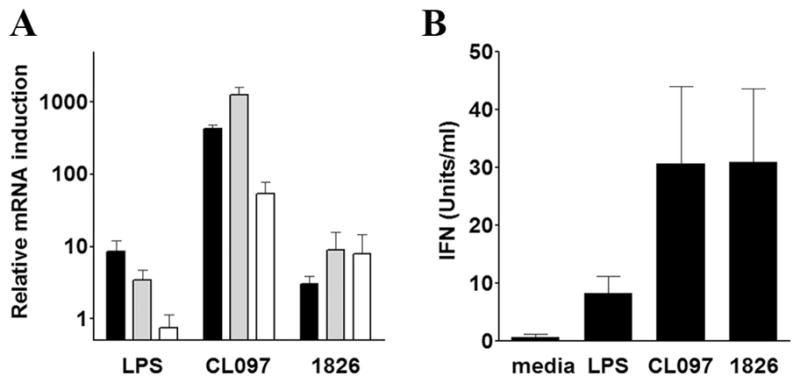
 , IFN-α2; and □, IFN-α4. Average ± SEM of three experiments. B, TLR-induced production of functional type I IFN. Type I IFN in the culture supernatant of B cells, stimulated for 6 h with indicated TLR-ligands, was measured by IFN bioassay. Average ± SEM of five experiments.
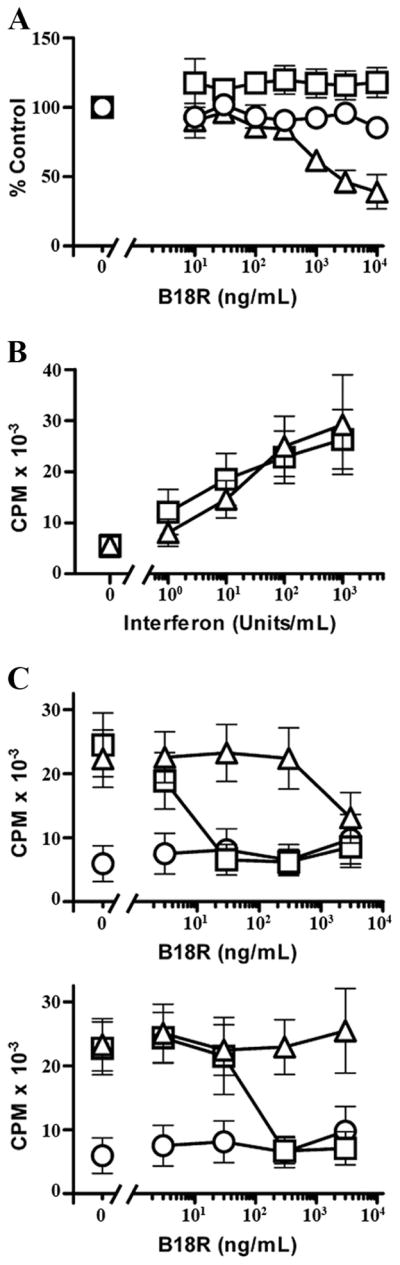
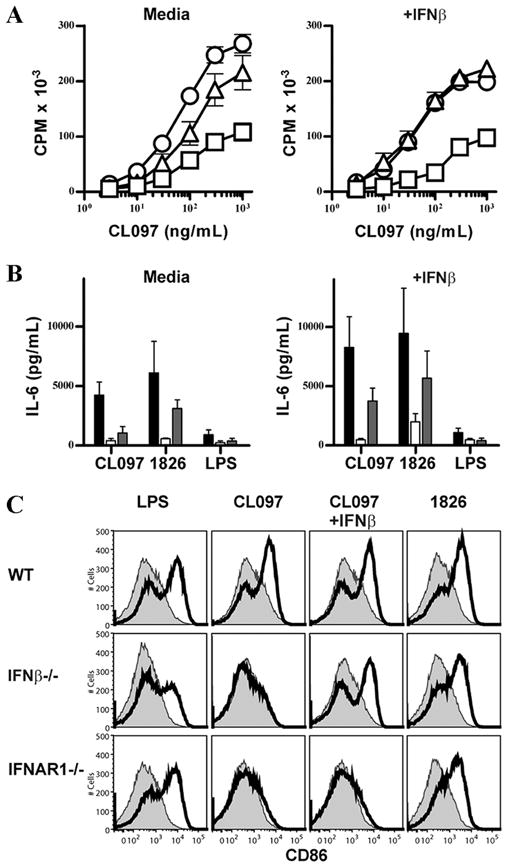 ) B cells were stimulated with 300 ng/ml CL097 in the absence (left) or presence (right) of 300 U/ml IFN-β. IL-6 concentration in the culture supernatants at 24 h was determined by ELISA. C, B cells from WT (top row), IFN-β−/− (middle row), and IFNAR1−/− (bottom row) mice were stimulated with LPS (left), CL097 (middle left), CL097 + IFN-β (middle right), or CpG (right). CD86 expression was measured by flow cytometry. Unstimulated B cells (shaded histogram) served as controls.
Similar articles
-
Toll-like receptor 7 and 9 defects in common variable immunodeficiency.J Allergy Clin Immunol. 2009 Aug;124(2):349-56, 356.e1-3. doi: 10.1016/j.jaci.2009.05.019. Epub 2009 Jul 9. J Allergy Clin Immunol. 2009. PMID: 19592080 Free PMC article.
-
B cell autophagy mediates TLR7-dependent autoimmunity and inflammation.Autophagy. 2015;11(7):1010-24. doi: 10.1080/15548627.2015.1052206. Autophagy. 2015. PMID: 26120731 Free PMC article.
-
Type I IFN receptor and the B cell antigen receptor regulate TLR7 responses via distinct molecular mechanisms.J Immunol. 2012 Aug 15;189(4):1757-64. doi: 10.4049/jimmunol.1200624. Epub 2012 Jul 11. J Immunol. 2012. PMID: 22786773
-
Regulation of autoreactive B cell responses to endogenous TLR ligands.Autoimmunity. 2010 Feb;43(1):76-83. doi: 10.3109/08916930903374618. Autoimmunity. 2010. PMID: 20014959 Free PMC article. Review.
-
An unexpected role for RNA-sensing toll-like receptors in a murine model of DNA accrual.Clin Exp Rheumatol. 2015 Jul-Aug;33(4 Suppl 92):S70-3. Epub 2015 Oct 12. Clin Exp Rheumatol. 2015. PMID: 26457825 Free PMC article. Review.
Cited by
-
B cell IFN-γ receptor signaling promotes autoimmune germinal centers via cell-intrinsic induction of BCL-6.J Exp Med. 2016 May 2;213(5):733-50. doi: 10.1084/jem.20151724. Epub 2016 Apr 11. J Exp Med. 2016. PMID: 27069113 Free PMC article.
-
Activation of autoreactive B cells by endogenous TLR7 and TLR3 RNA ligands.J Biol Chem. 2012 Nov 16;287(47):39789-99. doi: 10.1074/jbc.M112.383000. Epub 2012 Sep 27. J Biol Chem. 2012. PMID: 23019335 Free PMC article.
-
Regulation of B-cell responses by Toll-like receptors.Immunology. 2012 Aug;136(4):370-9. doi: 10.1111/j.1365-2567.2012.03587.x. Immunology. 2012. PMID: 22444240 Free PMC article. Review.
-
TLR8 on dendritic cells and TLR9 on B cells restrain TLR7-mediated spontaneous autoimmunity in C57BL/6 mice.Proc Natl Acad Sci U S A. 2014 Jan 28;111(4):1497-502. doi: 10.1073/pnas.1314121111. Epub 2014 Jan 13. Proc Natl Acad Sci U S A. 2014. PMID: 24474776 Free PMC article.
-
Expression of an anti-RNA autoantibody in a mouse model of SLE increases neutrophil and monocyte numbers as well as IFN-I expression.Eur J Immunol. 2014 Jan;44(1):215-26. doi: 10.1002/eji.201343714. Epub 2013 Oct 21. Eur J Immunol. 2014. PMID: 24105635 Free PMC article.
References
-
- Gota C, Calabrese L. Induction of clinical autoimmune disease by therapeutic interferon-α. Autoimmunity. 2003;36:511–518. - PubMed
-
- Hooks JJ, Moutsopoulos HM, Geis SA, Stahl NI, Decker JL, Notkins AL. Immune interferon in the circulation of patients with auto-immune disease. N Engl J Med. 1979;301:5–8. - PubMed
-
- Bengtsson AA, Sturfelt G, Truedsson L, Blomberg J, Alm G, Vallin H, Ronnblom L. Activation of type I interferon system in systemic lupus erythematosus correlates with disease activity but not with antiretroviral antibodies. Lupus. 2000;9:664–671. - PubMed
-
- Baechler EC, Gregersen PK, Behrens TW. The emerging role of interferon in human systemic lupus erythematosus. Cur Opin Immunol. 2004;16:801–807. - PubMed
Publication types
MeSH terms
Substances
Grants and funding
LinkOut - more resources
Full Text Sources
Molecular Biology Databases