Methylation-associated silencing of SFRP1 with an 8p11-12 amplification inhibits canonical and non-canonical WNT pathways in breast cancers
- PMID: 19569235
- PMCID: PMC2735097
- DOI: 10.1002/ijc.24518
Methylation-associated silencing of SFRP1 with an 8p11-12 amplification inhibits canonical and non-canonical WNT pathways in breast cancers
Abstract
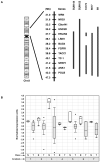
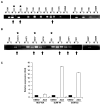
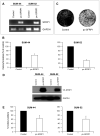
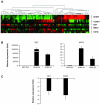
Recently, we analysed the 8p11-12 genomic region for copy number and gene expression changes in a panel of human breast cancer cell lines and primary specimens. We found that SFRP1 (Secreted frizzled related protein 1) is frequently under expressed even in breast tumours with copy number increases in this genomic region. SFRP1 encodes a WNT signalling antagonist, and plays a role in the development of multiple solid tumour types. In this study, we analysed methylation-associated silencing of the SFRP1 gene in breast cancer cells with the 8p11-12 amplicon, and investigated the tumour suppressor properties of SFRP1 in breast cancer cells. SFRP1 expression was markedly reduced in both the breast cancer cell lines and primary tumour specimens relative to normal primary human mammary epithelial cells even when SFRP1 is amplified. Suppression of SFRP1 expression in breast cancer cells with an SFRP1 gene amplification is associated with SFRP1 promoter methylation. Furthermore, restoration of SFRP1 expression suppressed the growth of breast cancer cells in monolayer, and inhibited anchorage independent growth. We also examined the relationship between the silencing of SFRP1 gene and WNT signalling in breast cancer. Ectopic SFRP1 expression in breast cancer cells suppressed both canonical and non-canonical WNT signalling pathways, and SFRP1 expression was negatively associated with the expression of a subset of WNT responsive genes including RET and MSX2. Thus, down-regulation of SFRP1 can be triggered by epigenetic and/or genetic events and may contribute to the tumourigenesis of human breast cancer through both canonical and non-canonical WNT signalling pathways.
Figures


Similar articles
-
Epigenetic silencing of sFRP1 activates the canonical Wnt pathway and contributes to increased cell growth and proliferation in hepatocellular carcinoma.Tumour Biol. 2012 Apr;33(2):325-36. doi: 10.1007/s13277-012-0331-5. Epub 2012 Feb 15. Tumour Biol. 2012. PMID: 22351518
-
Aberrant methylation of the Wnt antagonist SFRP1 in breast cancer is associated with unfavourable prognosis.Oncogene. 2006 Jun 8;25(24):3479-88. doi: 10.1038/sj.onc.1209386. Epub 2006 Jan 30. Oncogene. 2006. PMID: 16449975
-
[Epigenetic inactivation of the WNT antagonist SFRP1 in breast cancer].Verh Dtsch Ges Pathol. 2005;89:169-77. Verh Dtsch Ges Pathol. 2005. PMID: 18035687 German.
-
Turning the tables: Myc activates Wnt in breast cancer.Cell Cycle. 2007 Nov 1;6(21):2625-7. doi: 10.4161/cc.6.21.4880. Epub 2007 Aug 13. Cell Cycle. 2007. PMID: 17726380 Review.
-
Role of Secreted Frizzled-Related Protein 1 in Early Mammary Gland Tumorigenesis and Its Regulation in Breast Microenvironment.Cells. 2020 Jan 14;9(1):208. doi: 10.3390/cells9010208. Cells. 2020. PMID: 31947616 Free PMC article. Review.
Cited by
-
Reconstitution of secreted frizzled-related protein 1 suppresses tumor growth and lung metastasis in an orthotopic model of hepatocellular carcinoma.Dig Dis Sci. 2010 Oct;55(10):2838-43. doi: 10.1007/s10620-009-1099-3. Epub 2009 Dec 24. Dig Dis Sci. 2010. PMID: 20033841
-
SFRP1 Expression is Inversely Associated With Metastasis Formation in Canine Mammary Tumours.J Mammary Gland Biol Neoplasia. 2023 Jul 4;28(1):15. doi: 10.1007/s10911-023-09543-z. J Mammary Gland Biol Neoplasia. 2023. PMID: 37402051 Free PMC article.
-
Silencing microRNA-27a inhibits proliferation and invasion of human osteosarcoma cells through the SFRP1-dependent Wnt/β-catenin signaling pathway.Biosci Rep. 2019 Jun 4;39(6):BSR20182366. doi: 10.1042/BSR20182366. Print 2019 Jun 28. Biosci Rep. 2019. PMID: 31072914 Free PMC article.
-
Transforming properties of 8p11-12 amplified genes in human breast cancer.Cancer Res. 2010 Nov 1;70(21):8487-97. doi: 10.1158/0008-5472.CAN-10-1013. Epub 2010 Oct 12. Cancer Res. 2010. PMID: 20940404 Free PMC article.
-
Minireview: the molecular and genomic basis for prostate cancer health disparities.Mol Endocrinol. 2013 Jun;27(6):879-91. doi: 10.1210/me.2013-1039. Epub 2013 Apr 22. Mol Endocrinol. 2013. PMID: 23608645 Free PMC article. Review.
References
-
- Vogelstein B, Kinzler KW. Cancer genes and the pathways they control. Nat Med. 2004;10:789–99. - PubMed
-
- Esteller M. Cancer epigenomics: DNA methylomes and histone-modification maps. Nat Rev Genet. 2007;8:286–98. - PubMed
-
- Yang ZQ, Streicher KL, Ray ME, Abrams J, Ethier SP. Multiple interacting oncogenes on the 8p11-p12 amplicon in human breast cancer. Cancer research. 2006;66:11632–43. - PubMed
-
- Gelsi-Boyer V, Orsetti B, Cervera N, Finetti P, Sircoulomb F, Rouge C, Lasorsa L, Letessier A, Ginestier C, Monville F, Esteyries S, Adelaide J, et al. Comprehensive profiling of 8p11-12 amplification in breast cancer. Mol Cancer Res. 2005;3:655–67. - PubMed
Publication types
MeSH terms
Substances
Grants and funding
LinkOut - more resources
Full Text Sources
Medical
Molecular Biology Databases
Research Materials

