. 2009 Jun 26;137(7):1259-71.
doi: 10.1016/j.cell.2009.04.043.

Genomic antagonism between retinoic acid and estrogen signaling in breast cancer

Affiliations

Genomic antagonism between retinoic acid and estrogen signaling in breast cancer

Sujun Hua et al. Cell. .

Abstract

Retinoic acid (RA) triggers antiproliferative effects in tumor cells, and therefore RA and its synthetic analogs have great potential as anticarcinogenic agents. Retinoic acid receptors (RARs) mediate RA effects by directly regulating gene expression. To define the genetic network regulated by RARs in breast cancer, we identified RAR genomic targets using chromatin immunoprecipitation and expression analysis. We found that RAR binding throughout the genome is highly coincident with estrogen receptor alpha (ERalpha) binding, resulting in a widespread crosstalk of RA and estrogen signaling to antagonistically regulate breast cancer-associated genes. ERalpha- and RAR-binding sites appear to be coevolved on a large scale throughout the human genome, often resulting in competitive binding activity at nearby or overlapping cis-regulatory elements. The highly coordinated intersection between these two critical nuclear hormone receptor signaling pathways provides a global mechanism for balancing gene expression output via local regulatory interactions dispersed throughout the genome.


Figures

Figure 1
Figure 1. Genome-wide identification of RARγ and RARα binding sites in MCF-7 cells
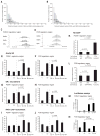
(A) Distribution of RARγ, RARα and ERα binding sites residing within 10 kb upstream or downstream to annotated transcription start sites (TSSs). (B) Cumulative frequency of RARγ and RARα binding sites for each 1 kb interval within 10 kb upstream or downstream to known TSSs. (C–G) Known RAR binding sites identified by ChIP-chip analyses. Black bars depict binding regions for RARγ and RARα. Known promoter-proximal RAR binding sites for HOXA1, HOXA4, HOXB1, CYP26A1, and FOXA1 were identified by genome-wide mapping in MCF-7. In addition, novel RAR binding sites 3′ to FOXA1 (F) and CYP26A1 (G) (denoted by red rectangles) were identified (H,I) Novel binding regions for CYP26A1 (H) and FOXA1 (I) enhance expression of reporter constructs upon RA treatment. Upon RA agonist treatment these constructs markedly enhanced firefly luciferase expression compared to the original pGL4.23 construct. Error bars represent s.d.
Figure 2
Figure 2. Co-localization of RARα, RARγ and ERα binding regions and antagonistic effects on gene expression between RA and estrogen signaling
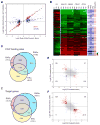
(A) Transcriptional response of RAs in MCF-7 cells is mediated by RARs. X-axis denotes Log2 transformed fold changes in gene expression after RA agonist treatment (100 nM AM580/CD437) relative to vehicle control (DMSO) treatment in mock RNAi experiments. X-axis shows Log2 transformed fold changes in gene expression after RA treatment relative to vehicle control treatment in mock RNAi experiment. Only genes with significant expression changes (1.5 fold change) were shown. Y-axis shows Log2 transformed fold changes in gene expression after RA treatment relative to vehicle control treatment in RARγ and RARα knockdown cells (siRARs, blue spots) and in RNAi control cells (siNT1, red spots). (B) Venn diagram displaying shared regions bound by RARγ, RARα, and ERα. ERα binding sites are based on the union of two recent genomic studies (Carroll et al., 2006; Hua et al., 2008) (C) Venn diagram displaying shared putative target genes of RARγ, RARα, and ERα, as defined by the presence of at least one binding region within 50 kb to the TSSs. (D) Comparison of time-course gene expression profiles induced by estrogen and different RA agonist treatment for 1,413 RA regulated genes. Genes containing binding sites within 50 kb to the TSSs are denoted by blue (RARγ, RARα or ERα) and red bars (RARs and ERα). (E,F) Comparison of gene expression changes in response to estrogen and RA agonists. X-axis shows Log2 transformed fold changes in gene expression after estrogen (10 nM E2) treatment relative to control (EtOH) treatment for 24 hours. Y-axis shows Log2 transformed fold changes in gene expression after RA agonist treatment (100 nM AM580 and 100 nM CD437) relative to vehicle control (DMSO) treatment for 72 hours in control-treated (siNT1) MCF-7 cells (E) and ERα-depleted (siER) MCF-7 cells (F). Genes with fold changes greater than 1.5 or less than -1.5 for both X- and Y-axes are highlighted in red or blue, respectively.
Figure 3
Figure 3. Antagonistic actions of RARs and ERα bound to shared regulatory elements
(A,B) Distance between binding region centers of ERα and RARα (A) or RARγ (B). (C,D) Ratios of normalized ChIP versus input signal intensities for the putative FOXA1 and FOS regulatory regions. Ratios were calculated from three replicates. Coordinates refer to UCSC hg16 (E,F) Histone 3 (H3) acetylation is antagonistically regulated by E2 and RA agonists at FOXA1 and FOS regulatory regions. RARγ-LAP MCF-7 cells grown in medium with charcoal-stripped FBS were either treated with vehicle or E2 (10 nM) for 45 minutes. The medium of E2-treated cells was then changed with medium containing vehicle (a), or CD437 (100 nM) (b), or a mixture of E2 (10 nM) and CD437 (100 nM). RA denotes CD437. Relative fold enrichment was determined by ChIP-qPCR using a pan-specific antibody against Acetyl-H3. (G–J) ERα and RARγ-LAP recruitment is antagonistically regulated by E2 and RA agonists at FOXA1 and FOS regulatory regions. Relative fold enrichment was determined by ChIP-qPCR using an antibody against ERα or eGFP using the chromatin obtained from the experiment described above (E–F). (K–L) FOXA1 and FOS regulatory regions do not co-bind ERα and RARγ-LAP. RARγ-LAP MCF-7 cells grown in medium with charcoal-stripped FBS were treated with E2 (10 nM) and CD437 (100 nM) for two hours. The first ChIP was performed with an antibody against ERα. Immunoprecipitated chromatin was eluted and a second ChIP was performed with IgG (negative control), or antibody against eGFP (targeting RARγ-LAP) or Acetyl-H3 (positive control). Relative enrichment was determined for the re-ChIPed chromatin by qPCR. (M–N) ERα/RAR binding region for FOS exhibits a differential response to estrogen and RA agonists. FOS and FOXA1 regulatory regions (FOS_2, FOXA1_1, Table S9) cloned into Firefly luciferase vector pGL4.23 were co-transfected into MCF-7 cells with the Renilla luciferase vector pGL4.73 used to correct for transfection efficiency. All error bars represent s.d.
Figure 4
Figure 4. Enriched hormone response elements (HREs) and evolutionary conservation of RAR and ERα binding regions
(A) Canonical HREs are composed of two half-sites (PuGGTCA) separated by a variable-length spacer. HREs can be configured as direct repeats (IR), everted repeats (ER), or inverted repeats (IR). (B) Motif enrichment analysis for all HREs with spacer lengths from 0 to 10 in RARα or RARγ, binding regions, RAR and ERα common regions (ERα/RAR), and RAR unique regions (RAR only). (C) Conservation profiles of RAR and ERα common sites (depicted in red), RAR unique sites (depicted in green) and ERα unique sites (depicted in blue). The conservation profile of local genomic background is depicted in black. (D) Conservation profiles of IR3 and DR5 motifs and 30 bp flanking regions in RAR and ERα common sites (depicted in red), RAR unique sites (depicted in green) and ERα unique sites (depicted in blue). The conservation profile of all predicted IR3 or DR5 motifs and 30 bp flanking regions in the human genome is depicted in black.
Figure 5
Figure 5. FoxA1 and GATA3 binding coincides with ERα and RAR binding
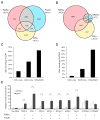
(A,B) Venn diagram of FoxA1, ERα, and RARs binding sites (A) or GATA3, ERα, and RARs sites (B). (C,D) Percentages of ERα unique sites, RAR unique sites, and ERα and RAR common sites co-localized with FoxA1 (C) or GATA3 (D) binding sites. (E) Effect of FoxA1 knockdown on RAR recruitment. Recruitment of RARγ (defined as fold enrichment relative to input DNA) was quantified by qPCR after ChIP using an eGFP antibody comparing depleted (siFoxA1) and control cells (siNT1). Reduced RARγ recruitment was only observed for seven RARγ sites co-localizing with FoxA1 sites but not for two unique RARγ sites or a negative control site. Error bars represent s.d. ***P < 0.001.
Figure 6
Figure 6. RAR targets as breast cancer relevant genes
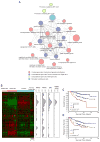
(A) Network view of functional modules enriched in RA-regulated genes. Each node represents a functional module or set of biologically relevant genes (see also Table S7). The node size is proportional to the minus logarithm of the adjusted P-value for testing the module enrichment of RA-regulated genes. Edge width correlates with the minus logarithm of the adjusted P-value for testing the enrichment between functional modules. (B) Hierarchical clustering of 146-breast tumor set using the UNC Intrinsic gene set (Hu et al.,2006). The density profiles for RARγ, RARα and ERα putative targets, as well as RAR and ERα common targets, were plotted. The density was calculated as the proportion of transcription factor putative targets in 50 neighbors for each gene in the cluster. (C,D) RAR targets as prognostic indicators. Kaplan-Meier curves of overall survival (C) and relapse-free survival (D) among the 295 patients (van de Vijver et al., 2002) classified by RA signature values. The patient samples are grouped in three categories based on RA signature scores: P (positive RA score) (n = 73), N (negative RA score) (n = 74), and U (uncorrelated) (n = 148). P-values were obtained from log-rank tests.
Figure 7
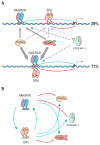
Figure 7. A model for the antagonistic regulation of target genes by RAR and ERα
(A) The antagonistic regulation of target genes by RAR and ERα can occur either through independent cis-regulatory elements, or as was most frequently found through shared binding regions of ERα and RARs. FoxA1 and GATA3 may be essential for RAR and/or ERα mediated gene regulation. FoxA1 may act as an initial chromatin binding factor and facilitate further recruitment of the RAR/RXR heterodimer, ERα homodimer, and/or other co-factors. The line and arrow width indicates the frequency that FoxA1 or GATA3 participates in different types of RAR or ER regulatory regions. Motif enrichment analysis predicts a potential role for AP-1 in ERα and RAR recruitment to these sites. (B) Transcriptional regulatory circuits composed of RAR, ERα, and their putative co-factors. The expression of FOXA1, GATA3, and FOS in MCF-7 cells is oppositely regulated by RAR and ERα upon RA or estrogen treatment. A negative feedback is achieved by positive cross-regulation between the two antagonizing transcription factors RAR and ERα

Similar articles

Cited by

References

    1. Altucci L, Leibowitz MD, Ogilvie KM, de Lera AR, Gronemeyer H. RAR and RXR modulation in cancer and metabolic disease. Nat Rev Drug Discov. 2007;6:793–810. - PubMed
    1. Ansel KM, Djuretic I, Tanasa B, Rao A. Regulation of Th2 differentiation and Il4 locus accessibility. Annu Rev Immunol. 2006;24:607–656. - PubMed
    1. Balmer JE, Blomhoff R. Gene expression regulation by retinoic acid. J Lipid Res. 2002;43:1773–1808. - PubMed
    1. Bernstein BE, Kamal M, Lindblad-Toh K, Bekiranov S, Bailey DK, Huebert DJ, McMahon S, Karlsson EK, Kulbokas EJ, 3rd, Gingeras TR, et al. Genomic maps and comparative analysis of histone modifications in human and mouse. Cell. 2005;120:169–181. - PubMed
    1. Carroll JS, Liu XS, Brodsky AS, Li W, Meyer CA, Szary AJ, Eeckhoute J, Shao W, Hestermann EV, Geistlinger TR, et al. Chromosome-wide mapping of estrogen receptor binding reveals long-range regulation requiring the forkhead protein FoxA1. Cell. 2005;122:33–43. - PubMed

Publication types

Associated data