In situ analysis of protein S-glutathionylation in lung tissue using glutaredoxin-1-catalyzed cysteine derivatization
- PMID: 19556513
- PMCID: PMC2708792
- DOI: 10.2353/ajpath.2009.080736
In situ analysis of protein S-glutathionylation in lung tissue using glutaredoxin-1-catalyzed cysteine derivatization
Abstract
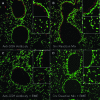
Protein S-glutathionylation (PSSG) is a posttranslational modification that involves the conjugation of the small antioxidant molecule glutathione to cysteine residues and is emerging as a critical mechanism of redox-based signaling. PSSG levels increase under conditions of oxidative stress and are controlled by glutaredoxins (Grx) that, under physiological conditions, preferentially deglutathionylate cysteines and restore sulfhydryls. Both the occurrence and distribution of PSSG in tissues is unknown because of the labile nature of this oxidative event and the lack of specific reagents. The goal of this study was to establish and validate a protocol that enables detection of PSSG in situ, using the property of Grx to deglutathionylate cysteines. Using Grx1-catalyzed cysteine derivatization, we evaluated PSSG content in mice subjected to various models of lung injury and fibrosis. In control mice, PSSG was detectable primarily in the airway epithelium and alveolar macrophages. Exposure of mice to NO(2) resulted in enhanced PSSG levels in parenchymal regions, while exposure to O(2) resulted in minor detectable changes. Finally, bleomycin exposure resulted in marked increases in PSSG reactivity both in the bronchial epithelium as well as in parenchymal regions. Taken together, these findings demonstrate that Grx1-based cysteine derivatization is a powerful technique to specifically detect patterns of PSSG expression in lungs, and will enable investigations into regional changes in PSSG content in a variety of diseases.
Figures


Similar articles
-
Ablation of glutaredoxin-1 attenuates lipopolysaccharide-induced lung inflammation and alveolar macrophage activation.Am J Respir Cell Mol Biol. 2011 Apr;44(4):491-9. doi: 10.1165/rcmb.2009-0136OC. Epub 2010 Jun 10. Am J Respir Cell Mol Biol. 2011. PMID: 20539014 Free PMC article.
-
Dysregulation of the glutaredoxin/S-glutathionylation redox axis in lung diseases.Am J Physiol Cell Physiol. 2020 Feb 1;318(2):C304-C327. doi: 10.1152/ajpcell.00410.2019. Epub 2019 Nov 6. Am J Physiol Cell Physiol. 2020. PMID: 31693398 Free PMC article.
-
Smoke decreases reversible oxidations S-glutathionylation and S-nitrosylation in mice.Free Radic Res. 2012 Feb;46(2):164-73. doi: 10.3109/10715762.2011.647011. Epub 2012 Jan 23. Free Radic Res. 2012. PMID: 22145974
-
Redox Regulation via Glutaredoxin-1 and Protein S-Glutathionylation.Antioxid Redox Signal. 2020 Apr 1;32(10):677-700. doi: 10.1089/ars.2019.7963. Epub 2020 Jan 23. Antioxid Redox Signal. 2020. PMID: 31813265 Free PMC article. Review.
-
Mechanisms of reversible protein glutathionylation in redox signaling and oxidative stress.Curr Opin Pharmacol. 2007 Aug;7(4):381-91. doi: 10.1016/j.coph.2007.06.003. Epub 2007 Jul 26. Curr Opin Pharmacol. 2007. PMID: 17662654 Review.
Cited by
-
Ablation of glutaredoxin-1 attenuates lipopolysaccharide-induced lung inflammation and alveolar macrophage activation.Am J Respir Cell Mol Biol. 2011 Apr;44(4):491-9. doi: 10.1165/rcmb.2009-0136OC. Epub 2010 Jun 10. Am J Respir Cell Mol Biol. 2011. PMID: 20539014 Free PMC article.
-
Temporal changes in glutaredoxin 1 and protein s-glutathionylation in allergic airway inflammation.PLoS One. 2015 Apr 13;10(4):e0122986. doi: 10.1371/journal.pone.0122986. eCollection 2015. PLoS One. 2015. PMID: 25874776 Free PMC article.
-
Biochemical methods for monitoring protein thiol redox states in biological systems.Redox Biol. 2014 Jun 13;2:803-13. doi: 10.1016/j.redox.2014.06.005. eCollection 2014. Redox Biol. 2014. PMID: 25009782 Free PMC article. Review.
-
Chasing cysteine oxidative modifications: proteomic tools for characterizing cysteine redox status.Circ Cardiovasc Genet. 2012 Oct 1;5(5):591. doi: 10.1161/CIRCGENETICS.111.961425. Circ Cardiovasc Genet. 2012. PMID: 23074338 Free PMC article.
-
Glutaredoxin attenuates glutathione levels via deglutathionylation of Otub1 and subsequent destabilization of system xC.Sci Adv. 2023 Sep 15;9(37):eadi5192. doi: 10.1126/sciadv.adi5192. Epub 2023 Sep 13. Sci Adv. 2023. PMID: 37703360 Free PMC article.
References
-
- Shackelford RE, Heinloth AN, Heard SC, Paules RS. Cellular and molecular targets of protein S-glutathiolation. Antioxid Redox Signal. 2005;7:940–950. - PubMed
-
- Ghezzi P, Bonetto V, Fratelli M. Thiol-disulfide balance: from the concept of oxidative stress to that of redox regulation. Antioxid Redox Signal. 2005;7:964–972. - PubMed
-
- Shelton MD, Chock PB, Mieyal JJ. Glutaredoxin: role in reversible protein S-glutathionylation and regulation of redox signal transduction and protein translocation. Antioxid Redox Signal. 2005;7:348–366. - PubMed
-
- Gallogly MM, Mieyal JJ. Mechanisms of reversible protein glutathionylation in redox signaling and oxidative stress. Curr Opin Pharmacol. 2007;7:381–391. - PubMed
Publication types
MeSH terms
Substances
Grants and funding
LinkOut - more resources
Full Text Sources

