. 2009 Aug 14;284(33):21872-21880.
doi: 10.1074/jbc.M109.022749. Epub 2009 Jun 24.

SIRT1 controls the transcription of the peroxisome proliferator-activated receptor-gamma Co-activator-1alpha (PGC-1alpha) gene in skeletal muscle through the PGC-1alpha autoregulatory loop and interaction with MyoD

Affiliations

SIRT1 controls the transcription of the peroxisome proliferator-activated receptor-gamma Co-activator-1alpha (PGC-1alpha) gene in skeletal muscle through the PGC-1alpha autoregulatory loop and interaction with MyoD

Ramon Amat et al. J Biol Chem. .

Abstract

Peroxisome proliferator activated receptor-gamma co-activator-1alpha (PGC-1alpha) is a transcriptional co-activator that coordinately regulates the expression of distinct sets of metabolism-related genes in different tissues. Here we show that PGC-1alpha expression is reduced in skeletal muscles from mice lacking the sirtuin family deacetylase SIRT1. Conversely, SIRT1 activation or overexpression in differentiated C2C12 myotubes increased PGC-1alpha mRNA expression. The transcription-promoting effects of SIRT1 occurred through stimulation of PGC-1alpha promoter activity and were enhanced by co-transfection of myogenic factors, such as myocyte enhancer factor 2 (MEF2) and, especially, myogenic determining factor (MyoD). SIRT1 bound to the proximal promoter region of the PGC-1alpha gene, an interaction potentiated by MEF2C or MyoD, which also interact with this region. In the presence of MyoD, SIRT1 promoted a positive autoregulatory PGC-1alpha expression loop, such that overexpression of PGC-1alpha increased PGC-1alpha promoter activity in the presence of co-expressed MyoD and SIRT1. Chromatin immunoprecipitation showed that SIRT1 interacts with PGC-1alpha promoter and increases PGC-1alpha recruitment to its own promoter region. Immunoprecipitation assays further showed that SIRT1-PGC-1alpha interactions are enhanced by MyoD. Collectively, these data indicate that SIRT1 controls PGC-1alpha gene expression in skeletal muscle and that MyoD is a key mediator of this action. The involvement of MyoD in SIRT1-dependent PGC-1alpha expression may help to explain the ability of SIRT1 to drive muscle-specific gene expression and metabolism. Autoregulatory control of PGC-1alpha gene transcription seems to be a pivotal mechanism for conferring a transcription-activating response to SIRT1 in skeletal muscle.


Figures
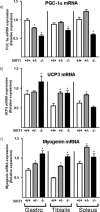
FIGURE 1.
FIGURE 1.
Expression of PGC-1α, UCP3, and myogenin mRNA in skeletal muscles from SIRT1-null mice. Gastrocnemius, tibialis anterior, and soleus muscles from 30-day-old SIRT1 homozygote-null mice (−/−), SIRT1 heterozygote-null mice (+/−), and wild-type littermates (+/+) were analyzed by quantitative reverse transcription-PCR. Data are presented as means ± S.E. of the relative abundance of transcript (8 mice/group). Statistically significant differences between SIRT1 −/− or SIRT1 +/− and SIRT1 +/+ are denoted by the asterisk (p < 0.05).
FIGURE 2.
FIGURE 2.
Effects of SIRT1 overexpression and SIRT1 activity modulators on PGC-1α gene expression in muscle cells. C2C12 myotubes were transduced with Ad-SIRT1 or Ad-GFP (control) and treated with 50 μm resveratrol (resveratrol) or 10 mm nicotinamide (NAM) for 24 h before harvesting. a, data are presented as means ± S.E. of relative transcript levels from three to five independent experiments. Statistically significant differences (p < 0.05) are denoted by the asterisk (SIRT1 versus GFP) and # (drug treatment versus absence). b, representative immunoblot showing Ad-SIRT1-mediated overexpression of SIRT1.
FIGURE 3.
FIGURE 3.
Effects of SIRT1 on PGC-1α gene promoter activity. C2C12 cells were transfected with a luciferase reporter construct driven by 2 kb of the mouse PGC-1α promoter region (PGC-1α -Luc). Data show the -fold induction of luciferase activity with respect to basal promoter values, and represent the means ± S.E. from at least three independent experiments performed in triplicate. a, cells were co-transfected with an expression vector for SIRT1 and treated with 50 μm resveratrol (RSV) or 10 mm NAM for 24 h, as indicated. Statistically significant differences (p < 0.05) due to drugs with respect to basal promoter values are denoted by the asterisk, and those due to the effects of SIRT1 are denoted by #. b, cells were co-transfected with expression vectors for PPARβ/δ, Foxo1, MEF2A, MEF2C, MEF2D, or MyoD, as indicated, as well as an expression vector for SIRT1 or the mutant form, SIRT1-H363Y. Cells transfected with PPARβ/δ were also treated with the specific agonist, 10 μm GW501516. Data show the -fold induction of luciferase activity with respect to basal promoter values, and represent the means ± S.E. from at least three independent experiments performed in triplicate. Statistically significant differences (p < 0.05) for each transfection condition with respect to basal promoter values are denoted by an asterisk, and those due to the effects of SIRT1 in the absence or presence of a given expression vector are denoted by #.
FIGURE 4.
FIGURE 4.
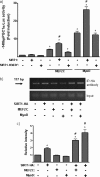
SIRT1 action on the myogenic factor-responsive region of the PGC-1α promoter. a, C2C12 cells were transfected with a promoter-reporter construct in which luciferase expression is driven by the proximal region (140 bp) of the PGC-1α gene promoter. Where indicated, cells were co-transfected with expression vectors for SIRT1, SIRT1-H363Y, MyoD, and/or MEF2C. Data show the -fold induction of luciferase activity with respect to basal promoter values and represent the means ± S.E. from at least three independent experiments performed in triplicate. Statistically significant differences (p < 0.05) for each transfection condition with respect to basal promoter values are denoted by an asterisk, and those due to the effects of SIRT1 in the absence or presence of a given expression vector are denoted by #. b, representative ChIP analysis of SIRT1 binding to the proximal region of the mouse PGC-1α promoter. Experiments were performed in the presence of a transfected 140-bp mPGC-1α-Luc construct and co-transfected expression vectors for HA-tagged SIRT1, MEF2C, and/or MyoD, as indicated. The arrow indicates the 177-bp PCR product from the mouse PGC-1α promoter. c, quantitative analysis of ChIP amplification. Data are expressed as the means ± S.E. of the -fold induction in relative intensity of the amplified PCR product from three independent experiments. Statistically significant differences (p < 0.05) are denoted by the asterisk (SIRT1-HA, MEF2C, or MyoD versus vector control) and # (MEF2c + SIRT1-HA or MyoD + SIRT1-HA versus SIRT1-HA, only).
FIGURE 5.
FIGURE 5.
Effects of SIRT1 on a MyoD response-defective mutant form of the human PGC-1α promoter. C2C12 cells were transfected with a luciferase construct containing 49 bp of the proximal human PGC-1α promoter core region (hPGC-1α-LUC wt) or a version in which the two E boxes (which mediate MyoD responsiveness) have been mutated (hPGC-1α-LUC Mt3). Cells were co-transfected with expression vectors for SIRT1 and/or MyoD as indicated. The results are expressed as -fold induction of luciferase activity with respect to basal promoter values, and represent the means ± S.E. of at least three independent experiments performed in triplicate. Statistically significant differences are denoted by the asterisk (MyoD versus vector control, p < 0.01), # (SIRT1 versus control vector, p < 0.01), and † (wt versus Mt3, p < 0.005).
FIGURE 6.
FIGURE 6.
Effects of a non acetylable form of MyoD on mediating the responsiveness of the PGC-1α promoter to SIRT1. C2C12 cells were transfected with the 2-kb mouse PGC-1α-Luc promoter construct and co-transfected with expression vectors for MyoD or MyoD-RRR (a non acetylable mutant form of MyoD) and SIRT1, as indicated. Results are presented as means ± S.E. of the -fold induction of relative luciferase activity with respect to basal activity. Statistically significant differences (p < 0.05) are denoted by the asterisk (MyoD versus vector control) and # (SIRT1 versus vector control).
FIGURE 7.
FIGURE 7.
Effects of P/CAF on the functional interaction of SIRT1 and MyoD on PGC-1α gene transcription. a, C2C12 cells were transfected with a luciferase reporter construct containing 2 kb of the mouse PGC-1α promoter region (mPGC-1α -Luc), and were co-transfected with expression vectors for MyoD, P/CAF, or P/CAFΔHAT (a mutated form of P/CAF devoid of acetyltransferase activity) and SIRT1, as indicated. Results are expressed as means ± S.E. of the -fold induction of relative luciferase activity with respect to basal activity. Statistically significant differences (p < 0.05) are denoted by the asterisk (MyoD versus vector control) and # (SIRT1 versus vector control). b, C2C12 cells were transfected with pTK-Luc (a luciferase expression vector driven by the thymidine kinase promoter) and co-transfected with pcDNA3-e2F1. DP1, P/CAF, and/or P/CAFΔHAT expression vectors were co-transfected, as indicated. Results are presented as means ± S.E. of at least three independent experiments. Statistically significant differences (p < 0.05) due to DP1 are denoted by the asterisk, and those due to the co-transfection of P/CAF expression vectors are denoted by #.
FIGURE 8.
FIGURE 8.
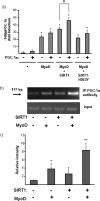
Effects of PGC-1α on the action of SIRT1 and MyoD at the PGC-1α gene promoter. a, CV1 cells were transfected with a promoter-reporter construct in which luciferase expression is driven by the proximal region (140 bp) of the PGC-1α gene promoter. Cells were co-transfected with expression vectors for PGC-1α, SIRT1, and/or MyoD, as indicated. Data are presented as -fold induction of luciferase activity with respect to basal promoter values, and represent the means ± S.E. of at least three independent experiments performed in triplicate. Statistically significant differences (p < 0.05) for each transfection condition with respect to basal promoter values are denoted by the asterisk, and those due to the effects of PGC-1α in the absence or presence of a given expression vector are denoted by #. b, representative ChIP analysis of PGC-1α binding to the proximal region of its own promoter. Experiments were performed in the presence of a transfected 140bpPGC-1α-Luc construct and co-transfected expression vectors for PGC-1α, SIRT1, and/or MyoD, as indicated. A representative ChIP analysis is shown. The arrow indicates the 177-bp PCR product from the mouse PGC-1α promoter. c, quantitative analysis of ChIP amplification. Data are expressed as the means ± S.E. of the -fold induction in relative intensity of the amplified PCR product from three independent experiments. Statistical significance of differences is denoted by: *, p < 0.05; **, p < 0.005.
FIGURE 9.
FIGURE 9.
Effect of MyoD on the interaction of PGC-1α with SIRT1. a, immunoprecipitation analysis of the interaction of PGC-1α with SIRT1. C2C12 cells were transduced with adenoviral vectors for PGC-1α and/or MyoD (left panel), and SIRT1 (right panel), as indicated. Cell extracts were immunoprecipitated (IP) using an antibody directed against PGC-1α and immunoblotted (IB) with an anti-SIRT1 antibody (top panel). Whole cell extracts were probed with the anti-SIRT1 antibody to confirm equivalent SIRT1 input before immunoprecipitation (bottom panels). b, C2C12 cells were transduced with adenoviral vectors for PGC-1α and/or MyoD, and SIRT1, as indicated. Cell extracts were immunoprecipitated using an antibody directed against SIRT1 and immunoblotted with an anti-PGC-1α antibody (top panel). Whole cell extracts were probed with the anti-PGC-1α antibody to confirm equivalent PGC-1α input before immunoprecipitation (bottom panel). c, C2C12 cells were transduced with adenoviral vectors for PGC-1α, MyoD, with or without co-transduction with the SIRT1 vector, as indicated. Cell extracts were immunoprecipitated using an antibody directed against MyoD and immunoblotted with an anti-PGC-1α antibody (top panel). Whole cell extracts were probed with the anti-PGC-1α antibody to confirm equivalent PGC-1α input before immunoprecipitation (bottom panel).
FIGURE 10.
FIGURE 10.
Schematic representation of the possible mechanism-of-action of SIRT1 on PGC-1α gene transcription. Schematic overview of the interaction of SIRT1 with MyoD and involvement of the PGC-1α positive autoregulatory loop.

Similar articles

Cited by

References

    1. Pilegaard H., Saltin B., Neufer P. D. (2003) Diabetes 52, 657–662 - PubMed
    1. Russell A. P., Feilchenfeldt J., Schreiber S., Praz M., Crettenand A., Gobelet C., Meier C. A., Bell D. R., Kralli A., Giacobino J. P., Dériaz O. (2003) Diabetes 52, 2874–2881 - PubMed
    1. Lin J., Wu H., Tarr P. T., Zhang C. Y., Wu Z., Boss O., Michael L. F., Puigserver P., Isotani E., Olson E. N., Lowell B. B., Bassel-Duby R., Spiegelman B. M. (2002) Nature 418, 797–801 - PubMed
    1. Chang J. H., Lin K. H., Shih C. H., Chang Y. J., Chi H. C., Chen S. L. (2006) Endocrinology 147, 3093–3106 - PubMed
    1. Handschin C., Rhee J., Lin J., Tarr P. T., Spiegelman B. M. (2003) Proc. Natl. Acad. Sci. U.S.A. 100, 7111–7116 - PMC - PubMed

Publication types

MeSH terms

LinkOut - more resources