. 2009 Sep 25;284(39):26732-41.
doi: 10.1074/jbc.M109.026922. Epub 2009 Jun 19.

Purification and functional reconstitution of monomeric mu-opioid receptors: allosteric modulation of agonist binding by Gi2

Affiliations

Purification and functional reconstitution of monomeric mu-opioid receptors: allosteric modulation of agonist binding by Gi2

Adam J Kuszak et al. J Biol Chem. .

Abstract

Despite extensive characterization of the mu-opioid receptor (MOR), the biochemical properties of the isolated receptor remain unclear. In light of recent reports, we proposed that the monomeric form of MOR can activate G proteins and be subject to allosteric regulation. A mu-opioid receptor fused to yellow fluorescent protein (YMOR) was constructed and expressed in insect cells. YMOR binds ligands with high affinity, displays agonist-stimulated [(35)S]guanosine 5'-(gamma-thio)triphosphate binding to Galpha(i), and is allosterically regulated by coupled G(i) protein heterotrimer both in insect cell membranes and as purified protein reconstituted into a phospholipid bilayer in the form of high density lipoprotein particles. Single-particle imaging of fluorescently labeled receptor indicates that the reconstituted YMOR is monomeric. Moreover, single-molecule imaging of a Cy3-labeled agonist, [Lys(7), Cys(8)]dermorphin, illustrates a novel method for studying G protein-coupled receptor-ligand binding and suggests that one molecule of agonist binds per monomeric YMOR. Together these data support the notion that oligomerization of the mu-opioid receptor is not required for agonist and antagonist binding and that the monomeric receptor is the minimal functional unit in regard to G protein activation and strong allosteric regulation of agonist binding by G proteins.


Figures

FIGURE 1.
FIGURE 1.
Functional expression of a modified MOR in insect cells. A, schematic representation of the modified μ-opioid receptor expressed in insect cells. N-terminal modifications included a hemagglutinin signal sequence (HA), FLAG epitope, His10, and a YFP. This construct, termed YMOR, was expressed in Sf9 and HighFiveTM insect cells using a recombinant Baculovirus system. B, YMOR expressed in insect cells exhibits high affinity ligand binding. Plasma membrane preparations (5 μg) of HighFiveTM cells expressing YMOR were used in [3H]diprenorphine saturation binding assays. YMOR bound [3H]DPN with a Bmax of ∼40 pmol/mg and a Kd of 0.6 ± 0.1 nm. C, YMOR couples to G protein in insect cell membranes. Membrane preparations (2 μg) of HighFiveTM cells co-expressing YMOR and Gi2 heterotrimer were incubated with increasing concentrations of the μ-opioid agonist DAMGO in the presence of 10 nm [35S]GTPγS (isotopically diluted). DAMGO stimulated [35S]GTPγS exchange on Gαi2 with an EC50 of 36 ± 0.1 nm. D, agonist binding to YMOR expressed in insect cells is allosterically regulated by G proteins. YMOR/Gi2 membrane preparations (2–3 μg) were incubated with 0.8 nm [3H]DPN and increasing concentrations of DAMGO in the absence or presence of 10 μm GTPγS. A high affinity binding site for DAMGO (●, Ki hi = ∼2.9 nm) was disrupted in the absence of G protein coupling (with GTPγS, ■, Ki = ∼300 nM). DAMGO also displayed low affinity binding to membranes not expressing Gi2 (YMOR, ▴, Ki = ∼580 nm; and YMOR + GTPγS, ▾, Ki = ∼800 nm). Binding data were normalized to the curve fit maximum. For all panels the data are representative of at least two experiments performed in duplicate, and the error bars represent the standard error of the mean.
FIGURE 2.
FIGURE 2.
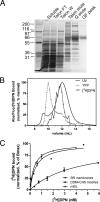
Purification of YMOR from HighFiveTM insect cells and reconstitution into HDL particles. A, YMOR was extracted from membranes in the presence of 100 nm naltrexone with 1% n-dodecyl-β-d-maltoside and 0.01% cholesteryl hemisuccinate and enriched on a TalonTM metal affinity column. The TalonTM pool containing YMOR (predicted 73-kDa molecular mass) was applied to a Source 15Q anion exchange column followed by a size exclusion gel filtration column (Superdex 200). Samples of the purification steps were resolved by SDS-PAGE and silver-stained. YMOR was enriched to ∼95% purity (GF peak). B, purified YMOR was reconstituted into HDL particles (see “Experimental Procedures”) and resolved by size exclusion chromatography (Superdex 200). Fractions were analyzed for total protein content (UV absorbance), active YMOR ([3H]DPN binding), and YFP fluorescence. UV absorbance showed a major peak corresponding to rHDL particles (stokes diameter of ∼10.5 nm). The elution volume of active YMOR corresponded with the rising slope of the rHDL peak. YFP fluorescence eluted as two peaks, corresponding to the active YMOR and a larger YMOR aggregate that was not incorporated into rHDL particles. This aggregated YMOR was not active based on [3H]DPN binding. The data were normalized such that the maximal value for each parameter was set to 100%. [3H]DPN binding measurements were performed in duplicate, and the error bars are omitted for clarity. C, high affinity [3H]DPN binding to YMOR is disrupted in detergent micelles but restored following reconstitution into rHDL particles. [3H]DPN binding to YMOR in insect cell membranes (●, Kd = ∼0.5 nm), purified in DDM micelles (■, Kd = ∼4.1 nm), and in rHDL particles (▴, Kd = ∼0.4 nm). The data are representative of at least three experiments performed in duplicate, and the error bars represent the standard error of the mean. The binding data were normalized to the maximal binding level (Bmax) as calculated by a one-site saturation curve fit (Prism 5.0, GraphPad).
FIGURE 3.
FIGURE 3.
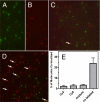
YMOR is monomeric when reconstituted into HDL particles. Purified YMOR was labeled with Cy3 or Cy5 fluorescent dyes and reconstituted separately or together into biotin-labeled rHDL. The particles were imaged using single-molecule total internal reflection fluorescence microscopy on quartz slides coated with streptavidin. Representative overlay images of reconstituted rHDL·Cy3-YMOR (A), rHDL·Cy5-YMOR (B), rHDL·(Cy3-YMOR + Cy5-YMOR) (C), and rHDL·Cy3-Cy5-YMOR (D) are shown. Quantification of Cy3 and Cy5 co-localization (E) showed that when both Cy3-YMOR and Cy5-YMOR were mixed together prior to reconstitution (mixture, 4c), only ∼3.4% of rHDL particles contained two labeled receptors, compared with a false-positive co-localization signal of 2.8 and 2.2% observed for the rHDL·Cy3-YMOR and rHDL·Cy5-YMOR samples. YMOR co-labeled with both Cy3 and Cy5 was also imaged as a positive control for co-localization. Approximately 24% of rHDL·Cy3-Cy5-YMOR particles (co-labeled, 4d) exhibited co-localization, indicating that not all YMOR received a secondary fluorescent dye under the labeling conditions.
FIGURE 4.
FIGURE 4.
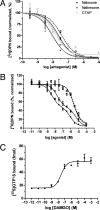
Monomeric YMOR binds ligands with high affinity and functionally couples to Gi2 heterotrimer. A, opioid antagonists bind YMOR in rHDL with affinities equivalent to those observed in membrane preparations. Competition binding assays were performed using plasma membranes of HighFiveTM cells expressing YMOR and Gi2 heterotrimer (dotted lines, open symbols) or rHDL·YMOR (solid lines, closed symbols). For CTAP binding assays in rHDL, YMOR was coupled to Gi2 heterotrimer. Increasing concentrations of naloxone, naltrexone, or CTAP competed the binding of 1 nm [3H]DPN in the rHDL system or 0.5 nm [3H]DPN in membrane preparations. The observed binding constants were: naloxone Ki mem = ∼19 nm, Ki rHDL = ∼7.8 nm; naltrexone Ki mem = ∼4.3 nm, Ki rHDL = ∼3.3 nm; CTAP Ki mem = ∼7.1 nm, Ki rHDL = ∼7.6 nm. B, binding of morphine to rHDL·YMOR is allosterically regulated by G proteins. Purified Gi2 heterotrimer was added to rHDL·YMOR at a molar ratio of 10:1, G protein to receptor. DAMGO and morphine bound rHDL·YMOR with high affinity, competing the binding of 0.75 nm [3H]DPN in a biphasic manner (DAMGO (■), Ki hi = ∼7.6 nm, Ki lo = ∼1.8 μm; morphine (●), Ki hi = ∼1.7 nm, Ki lo = ∼320 nm). High affinity agonist binding was lost with the addition of 10 μm GTPγS (DAMGO (□), Ki GTPγS = ∼1 μm; morphine (○), Ki GTPγS = ∼1 μm). In both A and B, data were normalized to the maximal binding level as calculated by a one- or two-site competition curve fit (Prism 5.0, GraphPad). C, HDL-reconstituted YMOR activates Gi2 in response to agonist binding. YMOR (an estimated 50–60 fmol) and associated Gi2 heterotrimer were incubated with 10 nm [35S]GTPγS (isotopically diluted) in the presence of increasing concentrations of DAMGO. DAMGO activated Gi2 with an EC50 of 29 ± 1.4 nm, stimulating ∼40 fmol of [35S]GTPγS binding to Gαi2 over basal levels, suggesting approximately a 1:0.7 coupling between YMOR and G protein. These results correlate with the estimated 53% high state observed in B. The data are representative of three experiments performed in duplicate. The error bars represent the standard error of the mean.
FIGURE 5.
FIGURE 5.
Single-molecule imaging of Cy3-labeled agonist binding to rHDL·YMOR + Gi2 confirms that the majority of YMOR is monomeric when reconstituted into HDL. Binding of [Lys7, Cys8]dermorphin-Cy3, a fluorescently labeled MOR-specific agonist, to rHDL·YMOR+Gi2 was observed with prism-based total internal reflection fluorescence microscopy. YMOR was reconstituted into HDL particles using biotinylated apoA-1, followed by Gi2 heterotrimer addition at a 30:1 G protein to receptor molar ratio. Reconstituted HDL (A) or rHDL·YMOR+Gi2 (B) were then incubated with a saturating concentration (500 nm) of [Lys7, Cys8]dermorphin-Cy3, adhered to a streptavidin-coated quartz slide, and washed with ice-cold 25 mm Tris·HCl, pH 7.7 buffer. Bound [Lys7, Cys8]dermorphin-Cy3 was continuously excited at 532 nm to observe photobleaching of the fluorophore. C, representative fluorescence intensity traces for a one- and two-step photobleach event are shown. The arrows indicate photobleach events. D and E, quantification of photobleaching showed that ∼95% of the bound [Lys7, Cys8]dermorphin-Cy3 bleached in a single step, suggesting that 95% of rHDL particles contained monomeric YMOR. [Lys7, Cys8]dermorphin-Cy3 binding was reversible, as shown the addition of 5 μm NTX. A minimum of four slide regions and 200 fluorescent spots were counted for each sample.

Similar articles

Cited by

References

    1. Blume A. J., Lichtshtein D., Boone G. (1979) Proc. Natl. Acad. Sci. U.S.A. 76, 5626–5630 - PMC - PubMed
    1. North R. A., Williams J. T., Surprenant A., Christie M. J. (1987) Proc. Natl. Acad. Sci. U.S.A. 84, 5487–5491 - PMC - PubMed
    1. Waldhoer M., Bartlett S. E., Whistler J. L. (2004) Annu. Rev. Biochem. 73, 953–990 - PubMed
    1. Bai M. (2004) Cell Signal. 16, 175–186 - PubMed
    1. Milligan G., Canals M., Pediani J. D., Ellis J., Lopez-Gimenez J. F. (2006) Ernst Schering Found. Symp. Proc. 2, 145–161 - PubMed

Publication types

MeSH terms

LinkOut - more resources