Disruption of protein kinase A in mice enhances healthy aging
- PMID: 19536287
- PMCID: PMC2693670
- DOI: 10.1371/journal.pone.0005963
Disruption of protein kinase A in mice enhances healthy aging
Erratum in
- PLoS One. 2010;5(2) doi: 10.1371/annotation/c7cad2dc-1eca-487e-89ae-151a22d8a0b4. Dai, Dao-Fu [added]
Abstract
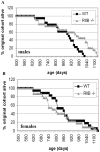
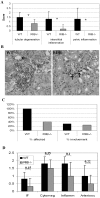
Mutations that cause a reduction in protein kinase A (PKA) activity have been shown to extend lifespan in yeast. Loss of function of mammalian RIIbeta, a regulatory subunit of PKA expressed in brain and adipose tissue, results in mice that are lean and insulin sensitive. It was therefore hypothesized that RIIB null (RIIbeta(-/-)) mice would express anti-aging phenotypes. We conducted lifespan studies using 40 mutant and 40 wild type (WT) littermates of equal gender numbers and found that both the median and maximum lifespans were significantly increased in mutant males compared to WT littermates. The median lifespan was increased from 884 days to 1005 days (p = 0.006 as determined by the log rank test) and the 80% lifespan (defined here as 80% deaths) was increased from 941 days to 1073 days (p = 0.004 as determined by the Wang-Allison test). There was no difference in either median or 80% lifespan in female genotypes. WT mice of both genders became increasingly obese with age, while mutant mice maintained their lean phenotype into old age. Adiposity was found to correlate with lifespan for males only. 50% of male mice between 30 and 35 g, corresponding to about 5% body fat, for either genotype lived over 1000 days. No male mouse outside of this weight range achieved this lifespan. During their last month of life, WT mice began losing weight (a total of 8% and 15% of body weight was lost for males and females, respectively), but RIIbeta(-/-) male mice maintained their lean body mass to end of life. This attenuation of decline was not seen in female mutant mice. Old male mutant mice were insulin sensitive throughout their life. Both genders showed modestly lower blood glucose levels in old mutants compared to WT. Male mutants were also resistant to age-induced fatty liver. Pathological assessment of tissues from end of life male mutant mice showed a decrease in tumor incidence, decreased severity of renal lesions, and a trend towards a decrease in age-related cardiac pathology. These findings help establish the highly conserved nature of PKA and suggest that disruption of PKA affects physiological mechanisms known to be associated with healthy aging.
Conflict of interest statement
Figures


Similar articles
-
Deficiency of the RIIβ subunit of PKA affects locomotor activity and energy homeostasis in distinct neuronal populations.Proc Natl Acad Sci U S A. 2013 Apr 23;110(17):E1631-40. doi: 10.1073/pnas.1219542110. Epub 2013 Apr 8. Proc Natl Acad Sci U S A. 2013. PMID: 23569242 Free PMC article.
-
Mutation of the RIIbeta subunit of protein kinase A prevents diet-induced insulin resistance and dyslipidemia in mice.Diabetes. 2001 Nov;50(11):2555-62. doi: 10.2337/diabetes.50.11.2555. Diabetes. 2001. PMID: 11679434
-
Deletion of the RIIbeta-subunit of protein kinase A decreases body weight and increases energy expenditure in the obese, leptin-deficient ob/ob mouse.Mol Endocrinol. 2005 Apr;19(4):982-91. doi: 10.1210/me.2004-0343. Epub 2004 Dec 23. Mol Endocrinol. 2005. PMID: 15618289
-
Extended longevity and insulin signaling in adipose tissue.Exp Gerontol. 2005 Nov;40(11):878-83. doi: 10.1016/j.exger.2005.07.004. Epub 2005 Aug 25. Exp Gerontol. 2005. PMID: 16125891 Review.
-
Protein kinase A signaling as an anti-aging target.Ageing Res Rev. 2010 Jul;9(3):269-72. doi: 10.1016/j.arr.2010.02.004. Epub 2010 Feb 24. Ageing Res Rev. 2010. PMID: 20188216 Review.
Cited by
-
Distinct regulation of Maf1 for lifespan extension by Protein kinase A and Sch9.Aging (Albany NY). 2015 Feb;7(2):133-43. doi: 10.18632/aging.100727. Aging (Albany NY). 2015. PMID: 25720796 Free PMC article.
-
Mechanisms underlying the anti-aging and anti-tumor effects of lithocholic bile acid.Int J Mol Sci. 2014 Sep 18;15(9):16522-43. doi: 10.3390/ijms150916522. Int J Mol Sci. 2014. PMID: 25238416 Free PMC article. Review.
-
Comparison of the effects of PRKAR1A and PRKAR2B depletion on signaling pathways, cell growth, and cell cycle control of adrenocortical cells.Horm Metab Res. 2014 Nov;46(12):883-8. doi: 10.1055/s-0034-1389951. Epub 2014 Sep 30. Horm Metab Res. 2014. PMID: 25268545 Free PMC article.
-
Intermittent and Periodic Fasting, Hormones, and Cancer Prevention.Cancers (Basel). 2021 Sep 13;13(18):4587. doi: 10.3390/cancers13184587. Cancers (Basel). 2021. PMID: 34572814 Free PMC article. Review.
-
Compartmentalized Signaling in Aging and Neurodegeneration.Cells. 2021 Feb 22;10(2):464. doi: 10.3390/cells10020464. Cells. 2021. PMID: 33671541 Free PMC article. Review.
References
-
- McKnight GS, Cummings DE, Amieux PS, Sikorski MA, Brandon EP, et al. Cyclic AMP, PKA, and the physiological regulation of adiposity. Recent Prog Hormone Res. 1998;53:139–161. - PubMed
-
- Longo VD. The Ras and Sch9 pathways regulate stress resistance and longevity. Exp Gerontol. 2003;38:807–811. - PubMed
-
- Lin SJ, Defossez PA, Guarente L. Requirement of NAD and SIR2 for life-span extension by calorie restriction in Saccharomyces cerevisiae. Science. 2000;289:2126–2128. - PubMed
-
- Enns LC, Wiley JC, Ladiges WC. Clinical relevance of transgenic mouse models for aging research. Crit Rev Eukaryot Gene Expr. 2008;18:81–91. - PubMed
-
- Yan L, Vatner DE, O'Connor P, Ivessa A, Ge H, et al. Type 5 adenylyl cyclase disruption increases longevity and protects against stress. Cell. 2007;130:247–258. - PubMed
Publication types
MeSH terms
Substances
Grants and funding
LinkOut - more resources
Full Text Sources
Medical
Molecular Biology Databases

