. 2009 Sep 4;284(36):24394-405.
doi: 10.1074/jbc.M109.014928. Epub 2009 Jun 16.

Crystal structures of human SIRT3 displaying substrate-induced conformational changes

Affiliations

Crystal structures of human SIRT3 displaying substrate-induced conformational changes

Lei Jin et al. J Biol Chem. .

Abstract

SIRT3 is a major mitochondrial NAD(+)-dependent protein deacetylase playing important roles in regulating mitochondrial metabolism and energy production and has been linked to the beneficial effects of exercise and caloric restriction. SIRT3 is emerging as a potential therapeutic target to treat metabolic and neurological diseases. We report the first sets of crystal structures of human SIRT3, an apo-structure with no substrate, a structure with a peptide containing acetyl lysine of its natural substrate acetyl-CoA synthetase 2, a reaction intermediate structure trapped by a thioacetyl peptide, and a structure with the dethioacetylated peptide bound. These structures provide insights into the conformational changes induced by the two substrates required for the reaction, the acetylated substrate peptide and NAD(+). In addition, the binding study by isothermal titration calorimetry suggests that the acetylated peptide is the first substrate to bind to SIRT3, before NAD(+). These structures and biophysical studies provide key insight into the structural and functional relationship of the SIRT3 deacetylation activity.


Figures
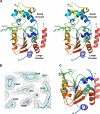
FIGURE 1.
FIGURE 1.
Structure of human SIRT3 in complex with the AceCS2-Kac peptide. A, cross-eye stereo view of the SIRT3-AceCS2-Kac structure. SIRT3 is presented in a ribbon representation and colored by a color range from blue of the N terminus to red of the C terminus. The top half of the molecule is the small domain binding to a zinc atom, and the bottom half is the large domain. The acetyl lysine of the AceCS2 peptide inserts in the cleft between the two domains and is in stick representation with carbon atoms in green, oxygen atoms in red, nitrogen atoms in blue, and the sulfur atom in yellow. The N and C termini of SIRT3 are labeled. B, residues surrounding the acetyl lysine binding site are in stick representation with the water molecules presented in red balls. The 2FoFo map is shown in gray wires and contoured at 1 σ. The residues involved in the binding of the acetyl lysine are labeled and discussed under “Results and Discussion.” C, the location of Met-142 in the large domain is indicated.
FIGURE 2.
FIGURE 2.
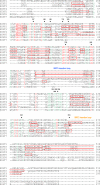
Sequence alignment of the core deacetylase domains of human SIRT1–7. The included sequences are SIRT1-207-573 (full-length, 747 a.a.), SIRT2-46-376 (389 a.a.), SIRT3-110-395 (399 a.a.), SIRT4-36-310 (314 a.a.), SIRT5-31-301 (310 a.a.), SIRT6-17-338 (355 a.a.), and SIRT7-67-377 (400 a.a.). The conserved residues are colored in red, and the functionally conserved residues are colored in green. Based on the crystal structures of SIRT2, -3, and -5, the α-helical regions are in red boxes, the β-sheets are underlined with solid lines, and the turn regions are underlined by dashed lines. The residues discussed under “Results and Discussion” are pointed by ▾ above the residues and labeled with the SIRT3 sequence number. The SIRT2 and SIRT5 insertion loops discussed under “Results and Discussion” are labeled. The alignment was done by T-Coffee (90).
FIGURE 3.
FIGURE 3.
Deacetylation activities of SIRT3-(102–399) and SIRT3-(118–399) determined by the mass spectrometry-based assay. The percentage of conversions from peptide substrate to product was determined with excess amounts of peptide substrate and NAD+. Vo is the initial velocity determined at each enzyme concentration in the unit of percentage of conversion of peptide substrate to product over time in minutes. The values of Vo and enzyme concentration were fit to a linear equation. The fitting result and statistics are included. The slope of the curve reflects the specific activity of the enzyme. The closed circle is for SIRT3-(118–399), and the open circle is for SIRT3-(102–399).
FIGURE 4.
FIGURE 4.
Structural comparison of the human SIRT3 structures with and without the AceCS2-Kac peptide. A, the superimposition of the Cα traces of the SIRT3-AceCS2-Kac structure and the six molecules (chains A–F) of the SIRT3 apo structure. The SIRT3-AceCS2-Kac structure is colored in green with the AceCS2-Kac peptide in the stick representation with carbon atoms colored in blue. For the SIRT3 apo structure, chain F is colored in purple, chain A-E are in gray, and the PEG molecules are in the stick representation with one in gray binding to chain C and one in purple binding to chain F. The large domains of the SIRT3 molecules are aligned well, and the relative positions of the small domains are shifted. Chain F (purple) of the apo structure is in the most open conformation compared with the SIRT3-AceCS2-Kac structure (green). B, a close up view of the acetyl lysine binding site. The color code is the same as in A. The orientations of His-248 and Phe-180 are shifted in the absence of the acetyl lysine at the binding site.
FIGURE 5.
FIGURE 5.
Structure of the SIRT3-AceCS2-Ks-ac crystal with a 1-h NAD+ soak (SIRT3-AceCS2-Ks-ac-ADPR). A, the initial step of dethioacetylation reaction by SIRT3. The NAM moiety of NAD+ is released first followed by the ADPR moiety of NAD+ transferred to the thioacetyl lysine, generating the S-alkylamidate. B, the FoFo omit electron density map (1 σ) for the S-alkylamidate intermediate (in stick representation) is presented by gray wires. C, superimposition of the SIRT3-AceCS2-Kac and SIRT3-AceCS2-Ks-ac-ADPR structures. The regions that have similar conformations are colored in gray for the SIRT3-AceCS2-Kac structure and in tinted yellow for the SIRT3-AceCS2-Ks-ac-ADPR structure. The flexible-loop region that has significant conformational difference is highlighted in magenta for the SIRT3-AceCS2-Kac structure and in blue for the SIRT3-AceCS2-Ks-ac-ADPR structure.
FIGURE 6.
FIGURE 6.
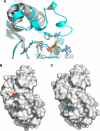
Structural comparison for the S-alkylamidate structures and surface representation of the SIRT3 structures. A, structural comparison of SIRT3-S-alkylamidate intermediate (SIRT3-AceCS2-Ks-ac-ADPR, in blue) with Sir2-Tm-S-alkylamidate intermediate (PDB code 3d81, in gray). The carbon atoms of the gatekeeper phenylalanine residues and the S-alkylamidate are in stick representation and colored in the same color as the respective structures. The phenyl ring of Phe-157 in SIRT3 is perpendicular relative to the ribosyl ring of the ADPR, whereas that of Phe-33 in Sir2Tm is in parallel. B, the SIRT3-AceCS2-Ks-ac-ADPR structure is presented in a surface representation, showing the opening to the β face of the ribosyl ring of ADPR that is in stick representation. The arrow points to the C1 atom of the ribosyl ring of ADPR where NAM connects to in NAD+. C, the SIRT3-AceCS2-Kac structure is presented in a surface representation in the same orientation as in B. ADPR is left in the structure to serve as a reference for the comparison between C and B.
FIGURE 7.
FIGURE 7.
Structure of the SIRT3-AceCS2-Ks-ac crystal with 16 h NAD+ soak. A, the FoFo omit electron density map (2 σ) for the dethioacetylated AceCS2 (in stick representation) is presented by the blue wires. B, the structure of the SIRT3-AceCS2-Ks-ac crystal with 16 h NAD+ soak (in blue) is superimposed with the structure of SIRT3-AceCS2-Kac (in gray). The arrow points to the flexible loops that are superimposed well between the two structures.
FIGURE 8.
FIGURE 8.
Isothermal titration calorimetry study of the substrate binding to SIRT3. A, the sequential heat pulses and the integrated heat data for the AceCS2-Kac peptide titrating to SIRT3 show a direct binding fitted to a single-site binding model. B, the sequential heat pulses and the integrated heat data for the NAD+ titrating to SIRT3 show no direct binding.
FIGURE 9.
FIGURE 9.
Structure comparison of SIRT3-AceCS2-Kac with SIRT2 (PDB code 1J8F) and SIRT5 (PDB code 2B4Y). The structurally conserved regions are colored in gray, and the structurally divergent regions are highlighted in different colors with SIRT3 in pink, SIRT2 in gold, and SIRT5 in blue. The black arrow points to the flexible loop region. Part of the flexible loop in SIRT5 is disordered. The blue arrow points to the insertion loop in SIRT5 that covers the top of the helix bundle region of the small domain. SIRT2 (in gold) has an insertion loop in the large domain that contains a helix with a hydrophobic surface formed by residues Phe-296, Met-299, and Leu-303 (in stick representation) and a unique N-terminal helix (there is a disordered loop after the N-terminal helix). Trp-353 of SIRT3 is presented in stick representation colored in pink. The N and C termini of all the structures are colored and labeled with letters in the respective colors.

Similar articles

Cited by

References

    1. Dutnall R. N., Pillus L. (2001) Cell 105, 161–164 - PubMed
    1. North B. J., Verdin E. (2004) Genome Biology 5, 224. - PMC - PubMed
    1. Landry J., Sutton A., Tafrov S. T., Heller R. C., Stebbins J., Pillus L., Sternglanz R. (2000) Proc. Natl. Acad. Sci. U.S.A. 97, 5807–5811 - PMC - PubMed
    1. Vaquero A., Scher M., Lee D., Erdjument-Bromage H., Tempst P., Reinberg D. (2004) Mol. Cell 16, 93–105 - PubMed
    1. Vaziri H., Dessain S. K., Ng Eaton E., Imai S. I., Frye R. A., Pandita T. K., Guarente L., Weinberg R. A. (2001) Cell 107, 149–159 - PubMed