

Auxin immunolocalization implicates vesicular neurotransmitter-like mode of polar auxin transport in root apices
- PMID: 19521492
- PMCID: PMC2635008
- DOI: 10.4161/psb.1.3.2759
Auxin immunolocalization implicates vesicular neurotransmitter-like mode of polar auxin transport in root apices
Abstract
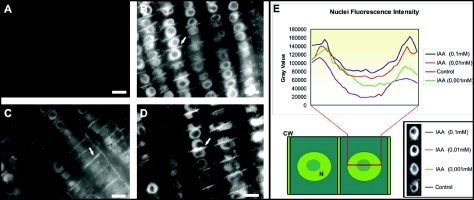
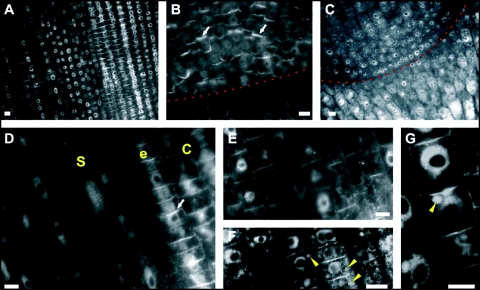
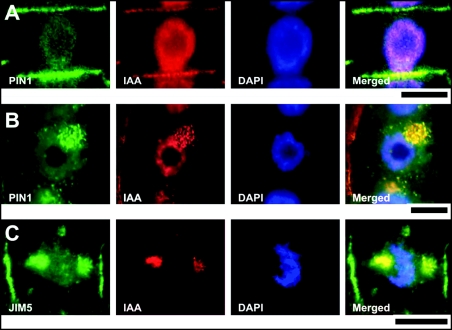
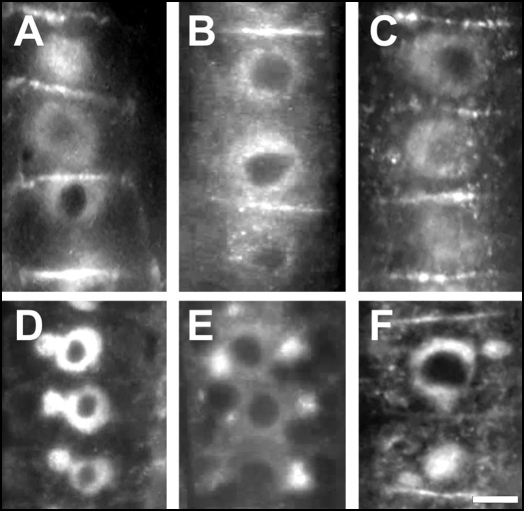
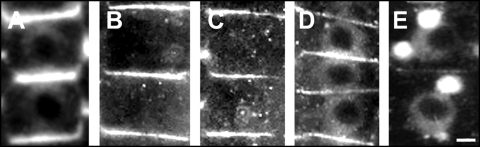
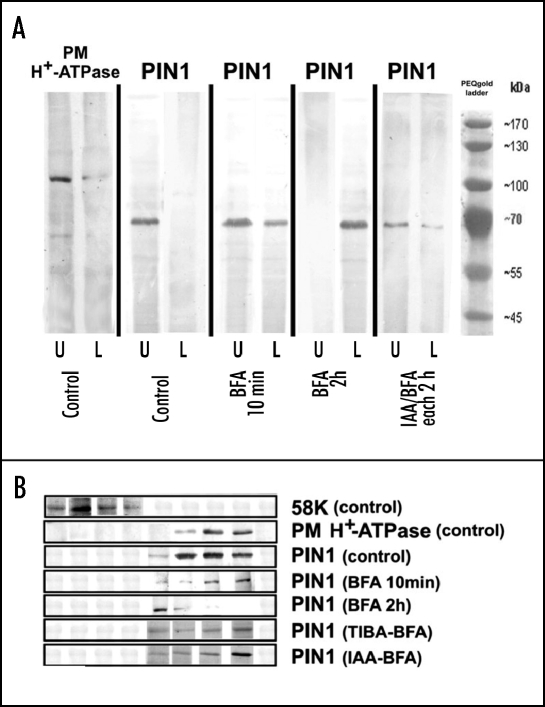
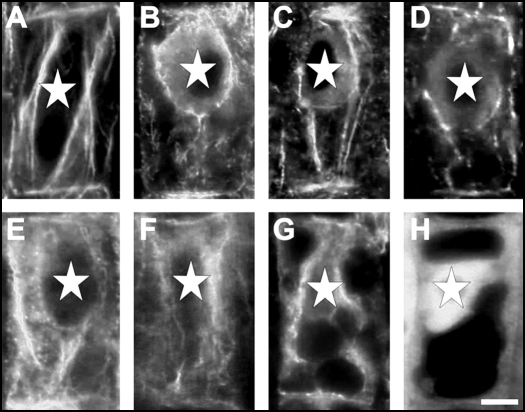
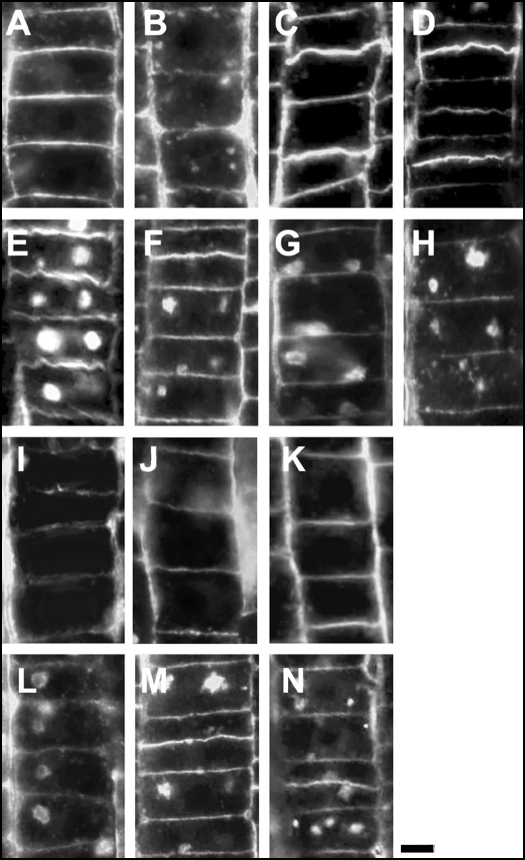
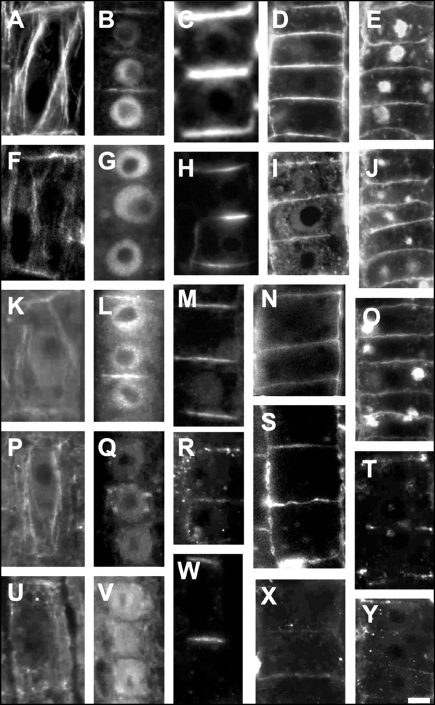
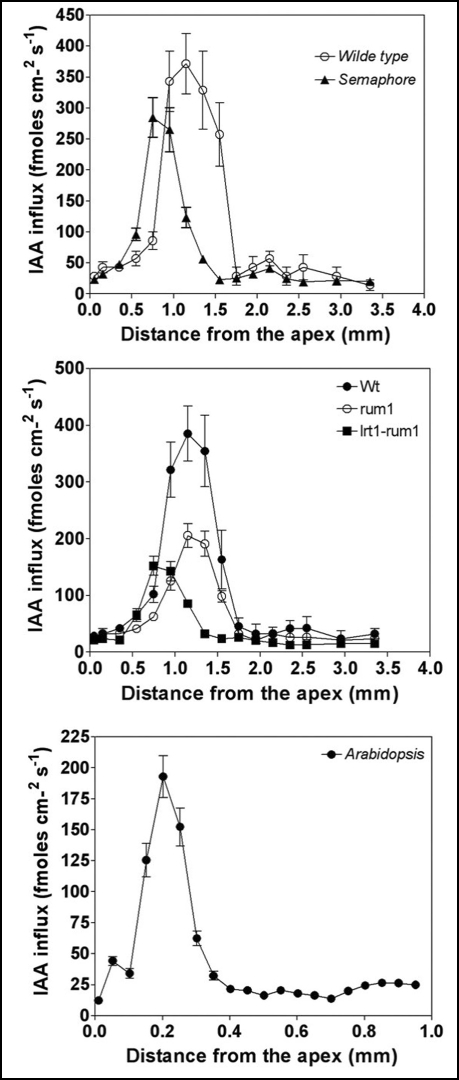
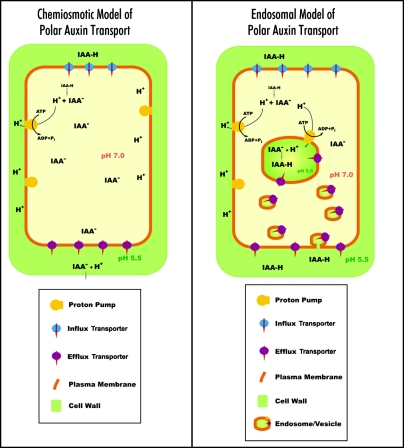
Immunolocalization of auxin using a new specific antibody revealed, besides the expected diffuse cytoplasmic signal, enrichments of auxin at end-poles (cross-walls), within endosomes and within nuclei of those root apex cells which accumulate abundant F-actin at their end-poles. In Brefeldin A (BFA) treated roots, a strong auxin signal was scored within BFA-induced compartments of cells having abundant actin and auxin at their end-poles, as well as within adjacent endosomes, but not in other root cells. Importantly, several types of polar auxin transport (PAT) inhibitors exert similar inhibitory effects on endocytosis, vesicle recycling, and on the enrichments of F-actin at the end-poles. These findings indicate that auxin is transported across F-actin-enriched end-poles (synapses) via neurotransmitter-like secretion. This new concept finds genetic support from the semaphore1, rum1 and rum1/lrt1 mutants of maize which are impaired in PAT, endocytosis and vesicle recycling, as well as in recruitment of F-actin and auxin to the auxin transporting end-poles. Although PIN1 localizes abundantly to the end-poles, and they also fail to support the formation of in these mutants affected in PAT, auxin and F-actin are depleted from their end-poles which also fail to support formation of the large BFA-induced compartments.
Keywords: actin; auxin; maize; neurotransmitter; secretion; vesicles.
Figures
Similar articles
-
Mutations in exocyst complex subunit SEC6 gene impaired polar auxin transport and PIN protein recycling in Arabidopsis primary root.Plant Sci. 2016 Sep;250:97-104. doi: 10.1016/j.plantsci.2016.06.001. Epub 2016 Jun 2. Plant Sci. 2016. PMID: 27457987
-
Phospholipase dzeta2 drives vesicular secretion of auxin for its polar cell-cell transport in the transition zone of the root apex.Plant Signal Behav. 2007 Jul;2(4):240-4. doi: 10.4161/psb.2.4.4566. Plant Signal Behav. 2007. PMID: 19516994 Free PMC article.
-
Acto-Myosin motorises the flow of auxin.Plant Signal Behav. 2007 Jul;2(4):247-8. doi: 10.4161/psb.2.4.3864. Plant Signal Behav. 2007. PMID: 19704667 Free PMC article.
-
Keeping it all together: auxin-actin crosstalk in plant development.J Exp Bot. 2015 Aug;66(16):4983-98. doi: 10.1093/jxb/erv308. Epub 2015 Jun 17. J Exp Bot. 2015. PMID: 26085676 Review.
-
Cellular events of strigolactone signalling and their crosstalk with auxin in roots.J Exp Bot. 2015 Aug;66(16):4855-61. doi: 10.1093/jxb/erv178. Epub 2015 Apr 21. J Exp Bot. 2015. PMID: 25900617 Review.
Cited by
-
Lateral root initiation and formation within the parental root meristem of Cucurbita pepo: is auxin a key player?Ann Bot. 2018 Nov 3;122(5):873-888. doi: 10.1093/aob/mcy052. Ann Bot. 2018. PMID: 29684107 Free PMC article.
-
TAA1-regulated local auxin biosynthesis in the root-apex transition zone mediates the aluminum-induced inhibition of root growth in Arabidopsis.Plant Cell. 2014 Jul;26(7):2889-904. doi: 10.1105/tpc.114.127993. Epub 2014 Jul 22. Plant Cell. 2014. PMID: 25052716 Free PMC article.
-
Polar auxin transport and asymmetric auxin distribution.Arabidopsis Book. 2007;5:e0108. doi: 10.1199/tab.0108. Epub 2007 Aug 21. Arabidopsis Book. 2007. PMID: 22303232 Free PMC article. No abstract available.
-
Vesicular secretion of auxin: Evidences and implications.Plant Signal Behav. 2008 Apr;3(4):254-6. doi: 10.4161/psb.3.4.5183. Plant Signal Behav. 2008. PMID: 19704646 Free PMC article.
-
Broadening the definition of a nervous system to better understand the evolution of plants and animals.Plant Signal Behav. 2021 Oct 3;16(10):1927562. doi: 10.1080/15592324.2021.1927562. Epub 2021 Jun 12. Plant Signal Behav. 2021. PMID: 34120565 Free PMC article. Review.
References
-
- Swarup R, Bennett M. Auxin transport: The fountain of life in plants? Dev Cell. 2003;5:824–826. - PubMed
-
- Bhalerao RP, Bennett MJ. The case for morphogens in plants. Nat Cell Biol. 2003;5:939–943. - PubMed
-
- Friml J, Vieten A, Sauer M, Weijers D, Schwarz H, Hamann T, Offringa R, Jürgens G. Efflux-dependent auxin gradients establish the apical-basal axis of Arabidopsis. Nature. 2003;426:147–153. - PubMed
-
- Friml J, Wisniewska J. Auxin as an intercellular signal. In: Flemming A, editor. Intercellular Communication in Plants. Vol. 16. Blackwell Publishing; 2005. (Annual Plant Reviews).
-
- Leyser O. Auxin distribution and plant pattern formation: How many angels can dance on the point of PIN? Cell. 2005;121:819–822. - PubMed
LinkOut - more resources
Full Text Sources
Miscellaneous