. 2009 Jul 8;28(13):1843-54.
doi: 10.1038/emboj.2009.153. Epub 2009 Jun 11.

JNK signalling modulates intestinal homeostasis and tumourigenesis in mice

Affiliations

JNK signalling modulates intestinal homeostasis and tumourigenesis in mice

Rocio Sancho et al. EMBO J. .

Abstract

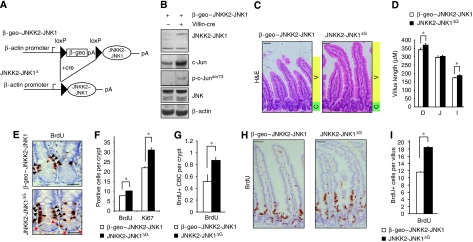
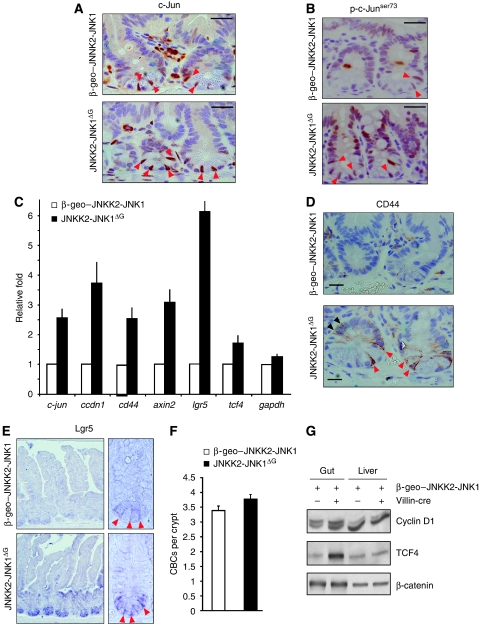
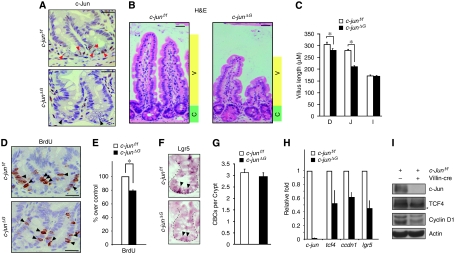
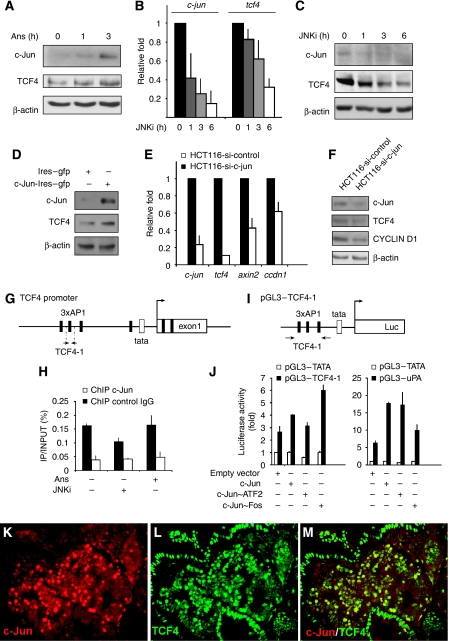
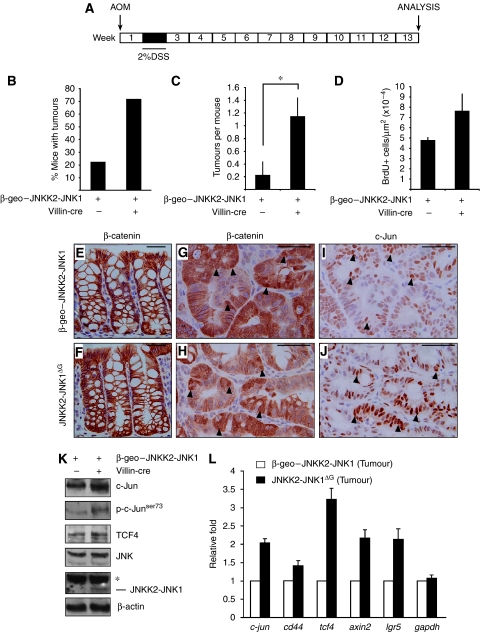
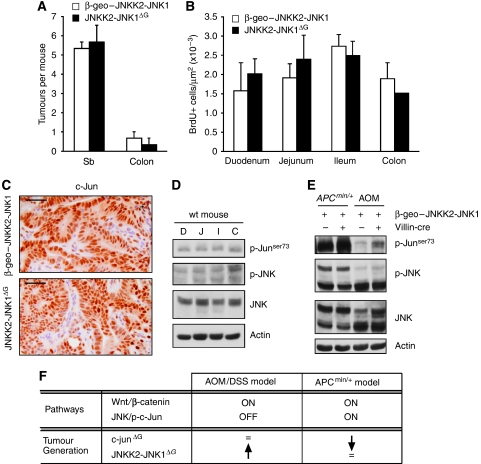
Wnt signalling is a crucial signalling pathway controlling intestinal homeostasis and cancer. We show here that the JNK MAP kinase pathway and one of its most important substrates, the AP-1 transcription factor c-Jun, modulates Wnt signalling strength in the intestine. Transgenic gut-specific augmentation of JNK signalling stimulated progenitor cell proliferation and migration, resulting in increased villus length. In the crypt, c-Jun protein was highly expressed in progenitor cells and the absence of c-Jun resulted in decreased proliferation and villus length. In addition to several known c-Jun/AP-1 target genes, expression of Wnt target genes Axin2 and Lgr5 were stimulated by JNK activation, suggesting a cross talk of JNK to Wnt signalling. Expression of the Wnt pathway component TCF4 was controlled by JNK activity, and chromatin immunoprecipitation and reporter assays identified tcf4 as a direct c-Jun target gene. Consequently, increased JNK activity accelerated tumourigenesis in a model of colorectal carcinogenesis. As c-jun is a direct target of the TCF4/beta-catenin complex, the control of tcf4 expression by JNK/c-Jun leads to a positive feedback loop that connects JNK and Wnt signalling. This mechanism regulates the physiological function of progenitor cells and oncogenic transformation.


Figures

Figure 1
Figure 1
JNK signalling increases progenitor cell proliferation and villus length. (A) Scheme of the β-geo–JNKK2-JNK1 construct before and after Cre recombination. When these single transgenic mice are crossed to Cre transgenic mice, the β-geo cassette is excised and the JNKK2-JNK1 cDNA is expressed. (B) Protein lysates from unrecombined β-geo–JNKK2-JNK1 and JNKK2-JNK1ΔG intestines were analysed for JNK1, c-Jun, ser 73 phosphorylated c-Jun (p-c-Junser73), total JNK and β-actin (loading control) expression. (C) Haematoxylin and eosin staining of duodenum epithelium from β-geo–JNKK2-JNK1 and JNKK2-JNK1ΔG mice. Green shading denotes proliferative zone (crypt, C) and yellow shading marks the zone of differentiation (villus, V). All animals were killed between 8–12 weeks. Scale bar represents 50 μM. (D) Quantification of the villus length from the base of the villus to the villus apex of β-geo–JNKK2-JNK1 and JNKK2-JNK1ΔG intestines. Histogram represents the villus length as mean ± s.e.m. in different regions of the gut (D=duodenum, J=jejunum and I=Ileum) (*P⩽0.05; student's t test). (E) Immunohistochemistry for BrdU on representative crypts of β-geo–JNKK2-JNK1 and JNKK2-JNK1ΔG intestines 2 h BrdU post-injection. Black arrowheads represent BrdU+ proliferative progenitors whereas red arrow heads indicate BrdU+ columnar base cells (CBC). Scale bar represents 30 μM. (F) Quantification of BrdU+ and Ki67+ cells in β-geo–JNKK2-JNK1 and JNKK2-JNK1ΔG crypts (*P⩽0.05; student's t test). (G) BrdU+ CBC quantification in β-geo–JNKK2-JNK1 and JNKK2-JNK1ΔG crypts (*P⩽0.05; student's t test). (H) Immunohistochemistry for BrdU on representative sections of β-geo–JNKK2-JNK1 and JNKK2-JNK1ΔG intestines 24 h BrdU post-injection. (I) Quantification of BrdU+ cells in the villi of β-geo–JNKK2-JNK1 and JNKK2-JNK1ΔG intestines 24 h BrdU post-injection (*P⩽0.05; student's t test). (n and P values are detailed in Supplementary Table S1).
Figure 2
Figure 2
Wnt target gene activation in JNKK2-JNK1ΔG mice. (A, B) Immunohistochemistry for c-Jun (A) or p-c-Junser73 (B) on representative crypts of β-geo–JNKK2-JNK1 and JNKK2-JNK1ΔG intestines. Red arrowheads represent c-Jun positively labelled columnar base cells (CBC). Scale bar represents 30 μM. (C) qRT–PCR analysis of c-jun, ccdn1, cd44, axin2, lgr5, tcf4 and gapdh transcripts in JNKK2-JNK1ΔG intestines compared with β-geo–JNKK2-JNK1. The data are normalized to β-actin and represented as fold induction over β-geo–JNKK2-JNK1 mice. (D) Immunohistochemistry for CD44 on representative crypts of β-geo–JNKK2-JNK1 and JNKK2-JNK1ΔG intestines. Red arrowheads indicate CD44 staining inCBC whereas black arrowheads indicate CD44+ proliferative progenitors. Scale bar represents 10 μM. (E) Lgr5 in situ hybridization in comparable regions from β-geo–JNKK2-JNK1 and JNKK2-JNK1ΔG intestines. (F) Quantification of CBCs in β-geo–JNKK2-JNK1 and JNKK2-JNK1ΔG crypts. (G) Western blot analysis of protein lysates from unrecombined β-geo–JNKK2-JNK1 and JNKK2-JNK1ΔG intestine and liver for cyclinD1, TCF4 and β-catenin expression.
Figure 3
Figure 3
Absence of c-Jun decreases crypt cell proliferation and villus length. (A) Immunohistochemistry for c-Jun on representative crypts from c-junf/f and c-junΔG intestines. Red arrow heads represent c-Jun positively labelled columnar base cells (CBC), black arrow heads represent c-Jun negative CBCs. Scale bar represents 30 μM. (B) Haematoxylin and eosin staining of jejunum epithelium from c-junf/f and c-junΔG mice. Green shading denotes proliferative zone (crypt, C) and yellow shading marks the zone of differentiation (villus, V). All animals were killed between 8–12 weeks. Scale bar represents 50 μM. (C) Quantification of the villus length from the base of the villus to the villus apex of c-junf/f and c-junΔG intestines. Histogram represents the villus length as mean ± s.e.m. in different regions of the gut (D=duodenum, J=jejunum and I=Ileum) (*P⩽0.05; student's t test). (D) Immunohistochemistry for BrdU on representative crypts from c-junf/f and c-junΔG intestines. Black arrowheads represent BrdU+ proliferative progenitors. Scale bar represents 25 μM. (E) Quantification of BrdU+ cells is represented in the histogram and expressed as % of positive cells per crypt, considering c-junf/f as 100% (*P⩽0.05; student's t test). (F) Lgr5 in situ hybridization in comparable crypts from c-junf/f and c-junΔG intestines. (G) Quantification of CBCs in c-junf/f and c-junΔG crypts. (H) qRT–PCR analysis of c-jun, ccdn1 and tcf4 transcripts in c-junΔG intestines compared with c-junf/f. The data are normalized to β-actin and represented as fold induction over c-junf/f mice. (I) Western analysis of protein lysates from c-junf/f and c-junΔG intestines for c-Jun, TCF4, cyclinD1 and β-actin (loading control). * indicates non-specific band. (n and P values are detailed in Supplementary Table S1).
Figure 4
Figure 4
tcf4 is a direct c-Jun target gene. (A) Western blot analysis of c-Jun and TCF4 protein levels in HCT116 cells treated with anisomycin (Ans) for the indicated time periods. (B) qRT–PCR analysis of c-jun and tcf4 transcripts in HCT116 cells treated with SP600125 (JNKi) for the indicated time periods. (C) Western analysis of protein lysates from HCT116 cells treated with SP600125 (JNKi) for c-Jun, TCF4 and β-actin (loading control). (D) Western blot analysis of c-Jun and TCF4 protein levels in HCT116 transfected with an expression plasmid for c-Jun (c-Jun-Ires–gfp) or empty vector (Ires–gfp). (E) qRT–PCR analysis of c-jun, tcf4, axin2 and ccdn1 transcripts in HCT116-si-c-jun (stable cell line that express an shRNA against c-jun) or HCT116-si-control (expressing an irrelevant shRNA) (F) Western blot analysis of c-Jun, TCF4, cyclinD1 and β-actin (loading control) in HCT116-si-c-jun and HCT116-si-control cell lines. (G) Schematic representation of TCF4 promoter. Black rectangles denote AP1 consensus binding sites. Arrows indicate approximate positions of qPCR primers used in ChIPs. (H) ChIP was carried out using HCT116 cells treated for 2 h with JNK inhibitor (JNKi) or Ans and c-Jun binding to the TCF4-1 region was determined by qPCR. Data is represented as IP/INPUT (%). Rabbit IgG antibody was used as an isotype control. (I) Schematic representation of pGL3–TCF4-1. (J) HCT116 cells were transfected with pGL3–TCF4-1, pGL3–uPA or pGL3–TATA together with c-Jun, c-Jun∼ATF2 and c-Jun∼Fos overexpression vector (or empty vector as control). Data represent luciferase activity relative to pGL3–TATA+empty-vector-transfected cells. (K–M) Double immunofluorescence for c-Jun (red; K) and TCF4 (green; L) and the merge image (M) on paraffin section from ApcMin/+ tumour.
Figure 5
Figure 5
JNK overexpression accelerates tumourigenesis in the AOM/DSS model of colon carcinoma. (A) Schematic representation of the experimental design followed. (B) Quantification of incidence of tumours. Data represent the % of mice with tumours (JNKK2-JNK1 (n=9) and JNKK2-JNK1ΔG (n=7)). (C) Quantification of number of AOM/DSS-induced tumours in β-geo–JNKK2-JNK1 and JNKK2-JNK1ΔG mice (*P⩽0.05; student's t test). (D) Quantification of BrdU+ cells per tumour area. (E–J) Immunohistochemistry for β-catenin in large bowel crypts adjacent to tumours (E, F) and β-catenin (G,H) and c-Jun (I,J) staining on AOM/DSS-induced tumours of β-geo–JNKK2-JNK1 and JNKK2-JNK1ΔG mice. Black arrowheads indicate some nuclear β-catenin or c-Jun positively labelled cells. Scale bar represents 50 μM. (K) Western blot analysis of c-Jun, p-c-Junser73, TCF4, JNK, JNKK2-JNK1 and β-actin as control in JNKK2-JNK1ΔG and β-geo–JNKK2-JNK1 AOM/DSS-induced colorectal tumours. (L) qRT–PCR analysis of c-jun, cd44, tcf4, axin2, lgr5 and gapdh transcripts in JNKK2-JNK1ΔG and β-geo–JNKK2-JNK1 AOM/DSS-induced colorectal tumours. The data are normalized to β-actin and represented as fold induction over β-geo–JNKK2-JNK1 mice tumour. (n and P values are detailed in Supplementary Table S1).
Figure 6
Figure 6
JNK overexpression in the APCMin/+ model of intestinal tumourigenesis. (A) Quantification of number of tumours in β-geo–JNKK2-JNK1 and JNKK2-JNK1ΔG mice in an APCMin/+ background. (B) Quantification of BrdU+ cells per area in tumours found in different intestinal regions. (C) Immunohistochemistry for c-Jun staining on APC-induced tumours of β-geo–JNKK2-JNK1 and JNKK2-JNK1ΔG mice. Scale bar represents 50 μM. (D) Western blot analysis of p-c-Junser73, p-JNK, JNK and β-actin in different intestinal regions in wild-type mouse (D: duodenum, J: jejunum, I: ileum and C: colon). (E)Western blot analysis of p-c-Junser73, p-JNK, JNK and β-actin in JNKK2-JNK1ΔG and β-geo–JNKK2-JNK1 tumours obtained in the two models used: AOM/DSS and APCMin/+.(F) Summary table with the proposed mechanism for tumour promotion/tumour suppression mediated by JNK/cJun pathway modulation in different intestinal tumourigenic models.

Similar articles

Cited by

References

    1. Angel P, Hattori K, Smeal T, Karin M (1988) The jun proto-oncogene is positively autoregulated by its product, Jun/AP1. Cell 55: 875–885 - PubMed
    1. Bakiri L, Matsuo K, Wisniewska M, Wagner EF, Yaniv M (2002) Promoter specificity and biological activity of tethered AP-1 dimers. Mol Cell Biol 22: 4952–4964 - PMC - PubMed
    1. Barker N, van de Wetering M, Clevers H (2008) The intestinal stem cell. Genes Dev 22: 1856–1864 - PMC - PubMed
    1. Barker N, van Es JH, Kuipers J, Kujala P, van den Born M, Cozijnsen M, Haegebarth A, Korving J, Begthel H, Peters PJ, Clevers H (2007) Identification of stem cells in small intestine and colon by marker gene Lgr5. Nature 449: 1003–1007 - PubMed
    1. Behrens A, Sibilia M, David JP, Mohle-Steinlein U, Tronche F, Schutz G, Wagner EF (2002) Impaired postnatal hepatocyte proliferation and liver regeneration in mice lacking c-jun in the liver. EMBO J 21: 1782–1790 - PMC - PubMed

Publication types

MeSH terms

Substances