. 2009 Jul 8;28(13):1904-15.
doi: 10.1038/emboj.2009.151. Epub 2009 Jun 4.

Rescue of key features of the p63-null epithelial phenotype by inactivation of Ink4a and Arf

Affiliations

Rescue of key features of the p63-null epithelial phenotype by inactivation of Ink4a and Arf

Xiaohua Su et al. EMBO J. .

Abstract

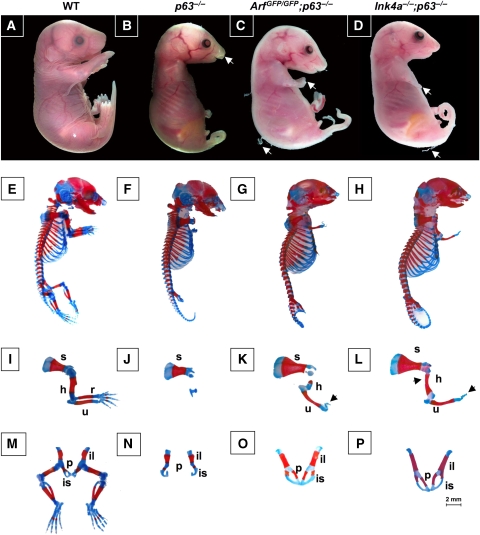
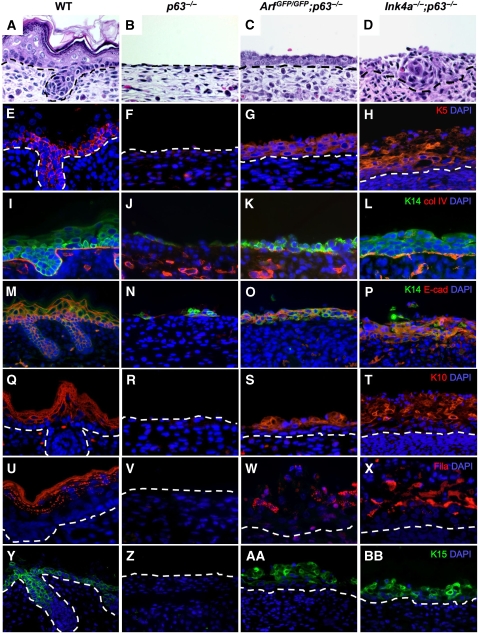
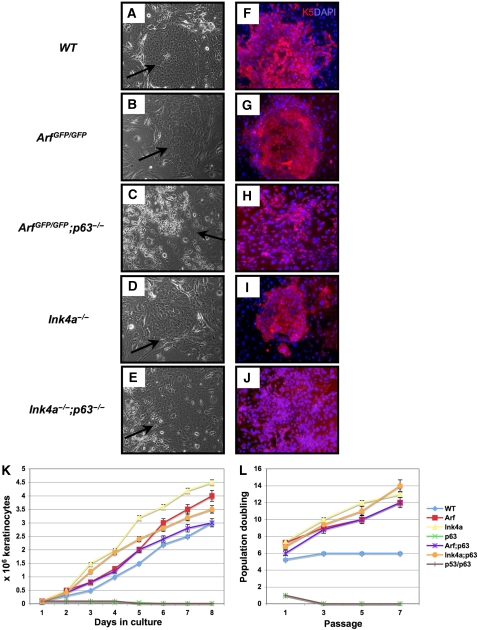
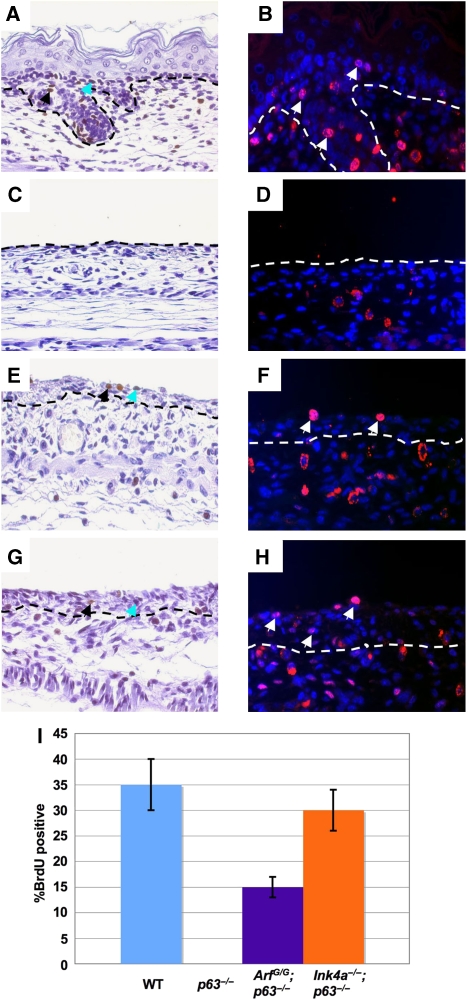
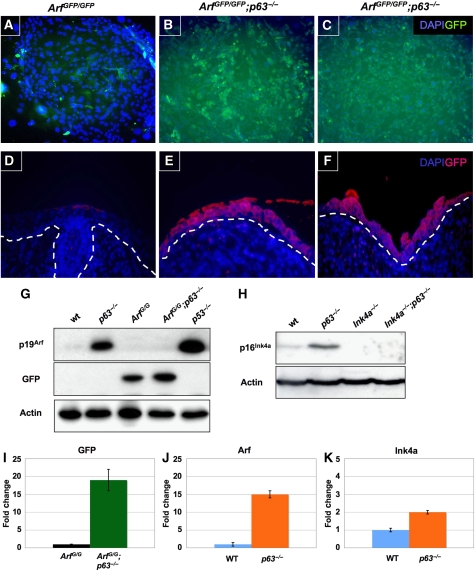
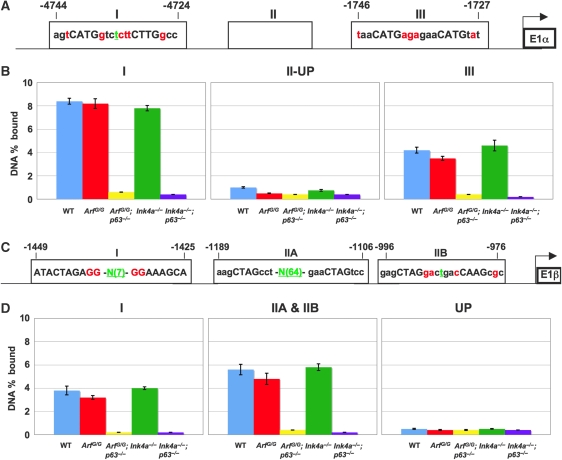
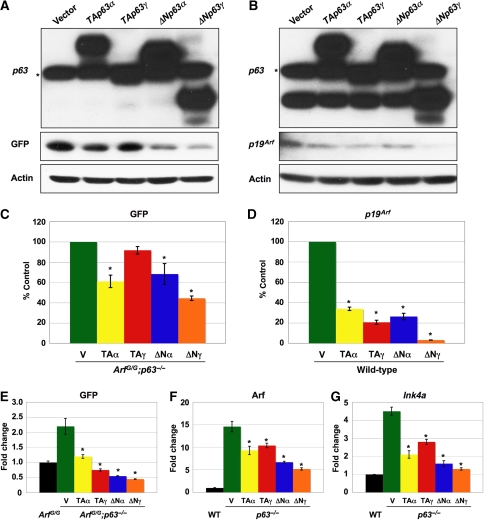
Mice lacking p63 cannot form skin, exhibit craniofacial and skeletal defects, and die soon after birth. The p63 gene regulates a complex network of target genes, and disruption of p63 has been shown to affect the maintenance of epithelial stem cells, the differentiation of keratinocytes, and the preservation of the adhesive properties of stratified epithelium. Here, we show that inactivation of p63 in mice is accompanied by aberrantly increased expression of the Ink4a and Arf tumour suppressor genes. In turn, anomalies of the p63-null mouse affecting the skin and skeleton are partially ameliorated in mice lacking either Ink4a or Arf. Rescue of epithelialization is accompanied by restoration of keratinocyte proliferative capacity both in vivo and in vitro and by expression of markers of squamous differentiation. Thus, in the absence of p63, abnormal upregulation of Ink4a and Arf is incompatible with skin development.


Conflict of interest statement

The authors declare that they have no conflict of interest.

Figures

Figure 1
Figure 1
Macroscopic analysis of embryos at day E18.5. (A–D) Illustrate images of embryos with their respective genotypes indicated above each panel; WT indicates wild type. The white arrow in (B) points to cleft lip and palate in p63−/− embryo. White arrows in (C, D) designate strings of desquamated epithelium and forelimbs. (E–P) Show skeletal preparations from E18.5 embryos stained with Alcian Blue for cartilage and alizarin red for bone. Whole embryos (E–H) were of the following genotypes: (E), wild type; (F), p63−/−; (G), ArfGFP/GFP;p63−/−; and (H), Ink4a−/−;p63−/−. Analysis of forelimbs (I–L) from (I), wild type; (J), p63−/−; (K), ArfGFP/GFP;p63−/−; and (L), Ink4a−/−;p63−/− embryos. The arrowheads in (K) and (L) point to rudimentary digits. Designated bones include the scapula (s), humerus (h), radius (r), and ulna (u). Analysis of pubic bones and hindlimbs (M–P) from (M), wild type; (N), p63−/−; (O), ArfGFP/GFP;p63−/−; and (P), Ink4a−/−;p63−/− embryos. Designated bones include the ilium (il), ischium (is), and pubic bone (p). A 2 mm scale bar is included in the corner of (P).
Figure 2
Figure 2
Microscopic analysis of the epithelium of embryos at E18.5. Cross sections of skin stained with haematoxylin and eosin (A–D) and immunofluorescence signals using antibodies to keratin 5 (red) (E–H), keratin 14 (green) and collagen IV (red) (I–L), keratin 14 (green) and E-cadherin (red) (M–P), keratin 10 (red) (Q–T), filaggrin (red) (U–X), and keratin 15 (green) (Y–BB) and counterstained with DAPI (blue) are illustrated. The genotypes for each vertical set of panels are indicated at the top of the figure. Broken lines define the border between the dermis and epidermis.
Figure 3
Figure 3
Keratinocyte cultures derived from embryos at E18.5. (A–E) Show light micrographs of keratinocytes cultured on J2-3T3 feeder cells with their respective genotypes indicated to the left of the panels. Black arrows indicate the positions of keratinocyte colonies. (F–J) Show immunofluorescence obtained with an antibody to keratin 5 (red), a marker of basal epithelial cells; cells were counterstained with DAPI (blue). (K) Indicates the proliferation rates of cultured keratinocytes of the following genotypes: wild type (WT, blue), ArfGFP/GFP (Arf, red), Ink4a−/− (Ink4a, yellow), p63−/− (p63, green), p53−/−;p63−/− (brown), ArfGFP/GFP;p63−/− (Arf;p63, purple), and Ink4a−/−;p63−/− (Ink4a;p63, orange). (L) Computes the cumulative population doublings of keratinocyte cultures passaged every 5 days for seven passages. The average of results obtained with three independent keratinocyte lines each assayed in triplicate is shown. The genotypes are indicated as in (K).
Figure 4
Figure 4
In vivo proliferation of epidermal cells in embryos at E18.5. (A, C, E, G) Show cross sections of skin labeled with BrdU (brown) and counterstained with haematoxylin (purple). Black arrows indicate positive cells and blue arrows indicate cells that stain weakly for BrdU. (B, D, F, H) Show immunofluorescence staining of skin sections with BrdU (red) and counterstained with DAPI (blue). Genotypes of the embryos are as follows: wild type (A, B), p63−/− (C, D), ArfGFP/GFP;p63−/− (E, F), and Ink4a−/−;p63−/− (G, H). White arrows indicate positive cells. Both were used to calculate the mitotic index shown in the bar graph in (I). The mitotic index is shown on the x-axis as the percentage of BrdU-positive cells on the surface of the epidermis.
Figure 5
Figure 5
Expression of p19Arf, p16Ink4a, and GFP in keratinocytes and stratified epithelium. (A–C) Illustrate GFP expression in keratinocytes of the indicated genotypes (top). Cells were counterstained with DAPI (blue). Representative colonies of cultured ArfGFP/GFP;p63−/− keratinocytes (B, C) were vividly fluorescent when compared (matched exposures) with cultures at the same passage derived from ArfGFP/GFP;p63+/+ mice (A). (D–F) Show cross sections of stratified epithelium from E18.5 embryos stained with antibodies to GFP (red). DAPI (blue) was used as a counterstain. The respective genotypes correspond to those indicated above (A–C). Matched exposures are shown. (G, H) Illustrate immunoblotting analysis of selected proteins (indicated at the left) identified in detergent lysates of age-matched passage-2 keratinocytes (B) of the indicated genotypes (top). Passage-2 p53−/− MEFs were used as a positive control (G). Actin was used as a loading control. (I–K) Show results from qRT–PCR of the indicated mRNAs (top) extracted from E18.5 dermis/epidermis of the indicated genotypes (bottom). GAPDH was used as an internal control.
Figure 6
Figure 6
p63 binds to response elements located on the Ink4a and Arf promoters. (A) Illustrates two p53/p63 consensus binding sites in the Ink4a promoter upstream of exon 1α. (B) Shows the percentage of total input DNA bound (DNA percentage bound) to p63. A graph for each region amplified (1-nucleotides -4835 to -4621, II-UP-nucleotides -3996 to -3845, and III-nucleotides -1850 to -1539) is shown. (C) Shows three p53/p63 consensus binding sites in the Arf promoter upstream of exon 1β. (D) Shows the percentage of total input DNA bound (DNA percentage bound) to p63. A graph for each region amplified (1-nucleotides -1533 to -1331, IIA and IIB-nucleotides -1276 to -943, and UP denotes a site upstream of site (I) from nucleotides -1811 to -1622). Genotypes of keratinocytes analysed are indicated below each bar on the graph. Nucleotides shown in red are those that do not match the consensus. Nucleotides in green correspond to those found in the spacer region. If the spacer was greater than 5, N(X) is shown where X=number of nucleotides in the spacer region.
Figure 7
Figure 7
p63 represses Arf and Ink4a. (A) Shows GFP expression in passage-2 ArfGFP/GFP;p63−/− MEFs transfected with the indicated expression vectors (top). (B) Illustrates p19Arf expression in passage-2 wild-type MEFs transfected with the indicated expression vectors (top). Both western blots in (A, B) were probed with a p63 antibody (4A4) specific for all isoforms of p63. The asterisk denotes a non-specific band. Actin was used as a loading control. (C, D) Show quantification of western blots, including the ones shown in (A, B), performed in triplicate. Actin was used as a loading control. (E–G) Show results from qRT–PCR of the indicated mRNAs (top) extracted from the sepcified MEFs transfected with the indicated expression vectors (bottom). GAPDH was used as an internal control. The asterisk denotes statistical significance (P<0.01).

Similar articles

Cited by

References

    1. Akala OO, Park I-K, Qian D, Pihalja M, Becker MW, Clarke MF (2008) Long-term hematopoietic reconstitution by Trp53−/−, p16Inka−/−, p19Arf−/− multipotent progenitors. Nature 453: 228–232 - PubMed
    1. Barrandon Y, Green H (1987) Three clonal types of keratinocyte with different capacities for multiplication. Proc Natl Acad Sci USA 84: 2302–2306 - PMC - PubMed
    1. Bertwistle D, Zindy F, Sherr CJ, Roussel MF (2004) Monoclonal antibodies to the mouse p19(Arf) tumor suppressor protein. Hybrid Hybridomics 23: 293–300 - PubMed
    1. Bracken AP, Kleine-Kohlbrecher D, Dietrich N, Pasini D, Gargiulo G, Beekman C, Theilgaard-Monch K, Minucci S, Porse BT, Marine JC, Hansen KH, Helin K (2007) The Polycomb group proteins bind throughout the INK4A-ARF locus and are disassociated in senescent cells. Genes Dev 21: 525–530 - PMC - PubMed
    1. Bruggeman SW, Valk-Lingbeek ME, van der Stoop PP, Jacobs JJ, Kieboom K, Tanger E, Hulsman D, Leung C, Arsenijevic Y, Marino S, van Lohuizen M (2005) Ink4a and Arf differentially affect cell proliferation and neural stem cell self-renewal in Bmi1-deficient mice. Genes Dev 19: 1438–1443 - PMC - PubMed

Publication types

MeSH terms

LinkOut - more resources