. 2009 May 29;137(5):835-48.
doi: 10.1016/j.cell.2009.05.006.

A genome-wide RNAi screen identifies multiple synthetic lethal interactions with the Ras oncogene

Affiliations

A genome-wide RNAi screen identifies multiple synthetic lethal interactions with the Ras oncogene

Ji Luo et al. Cell. .

Abstract

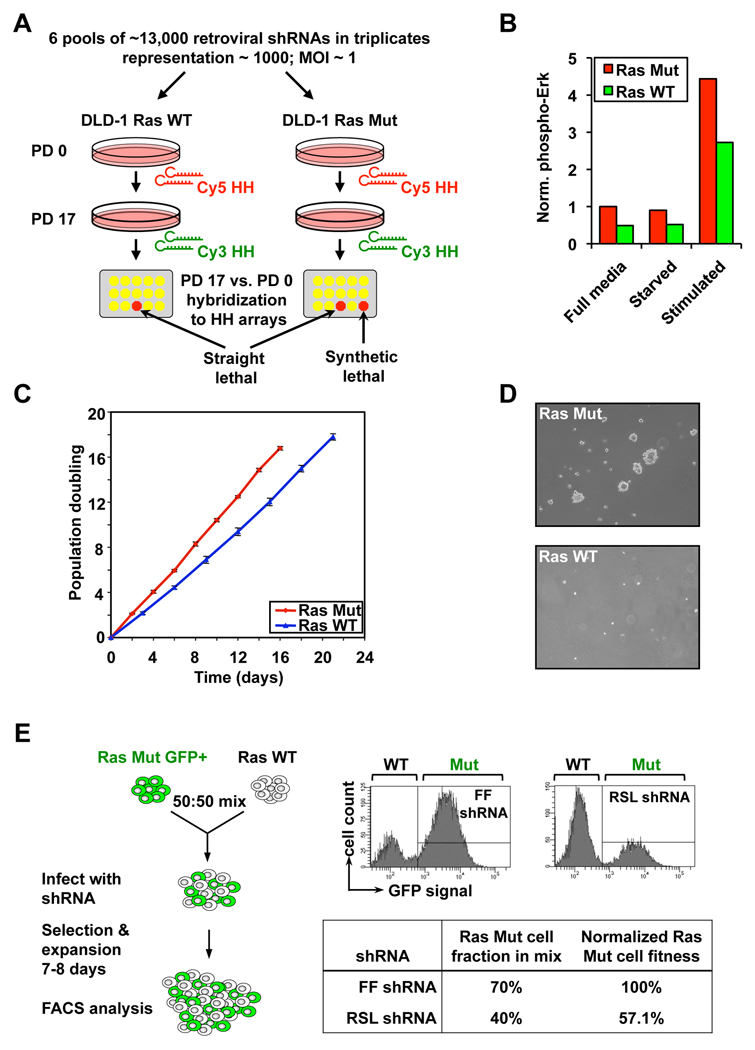
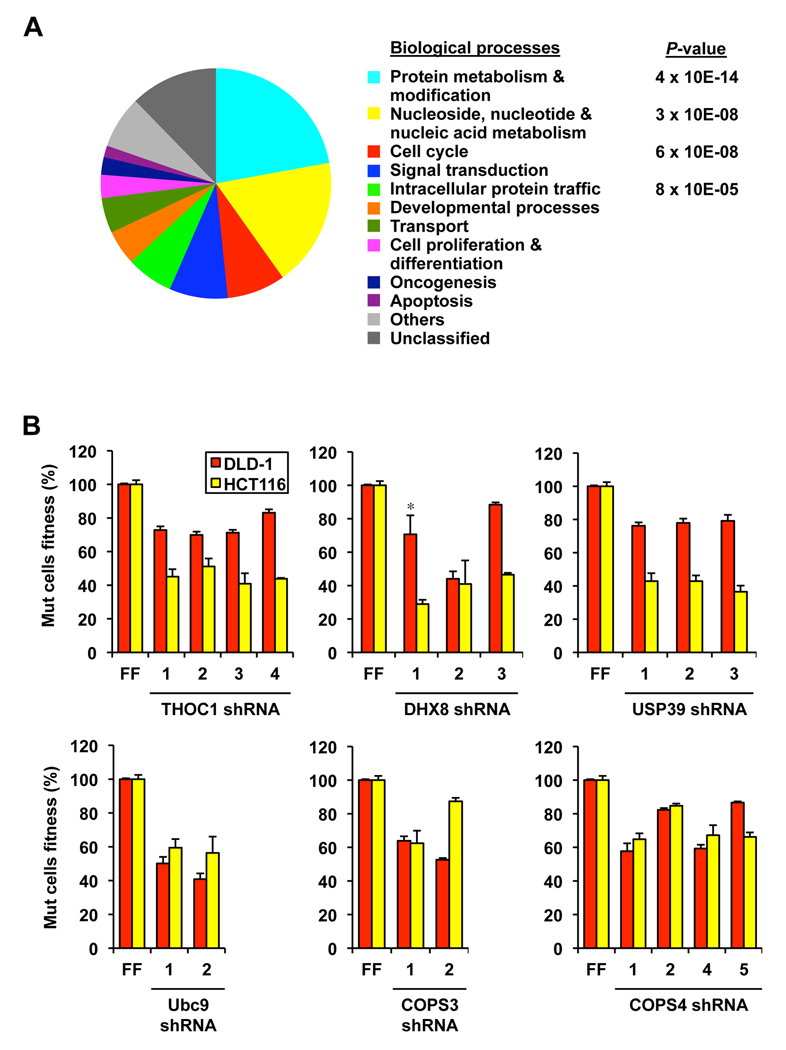
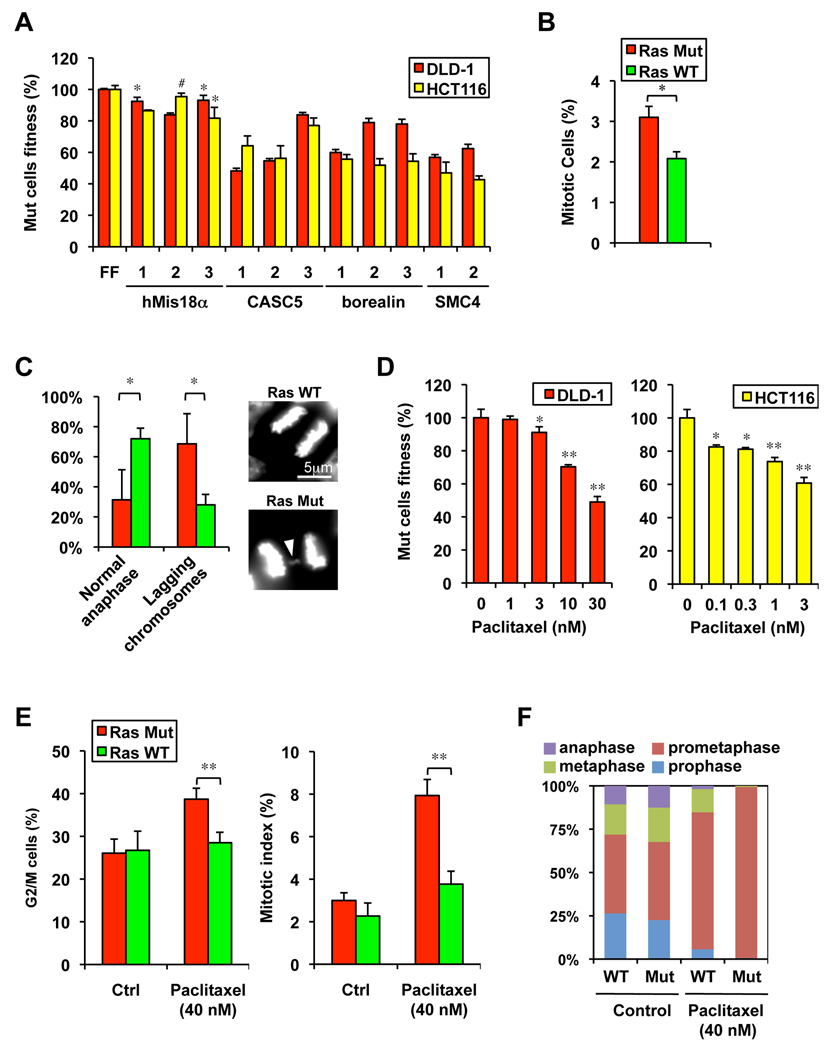
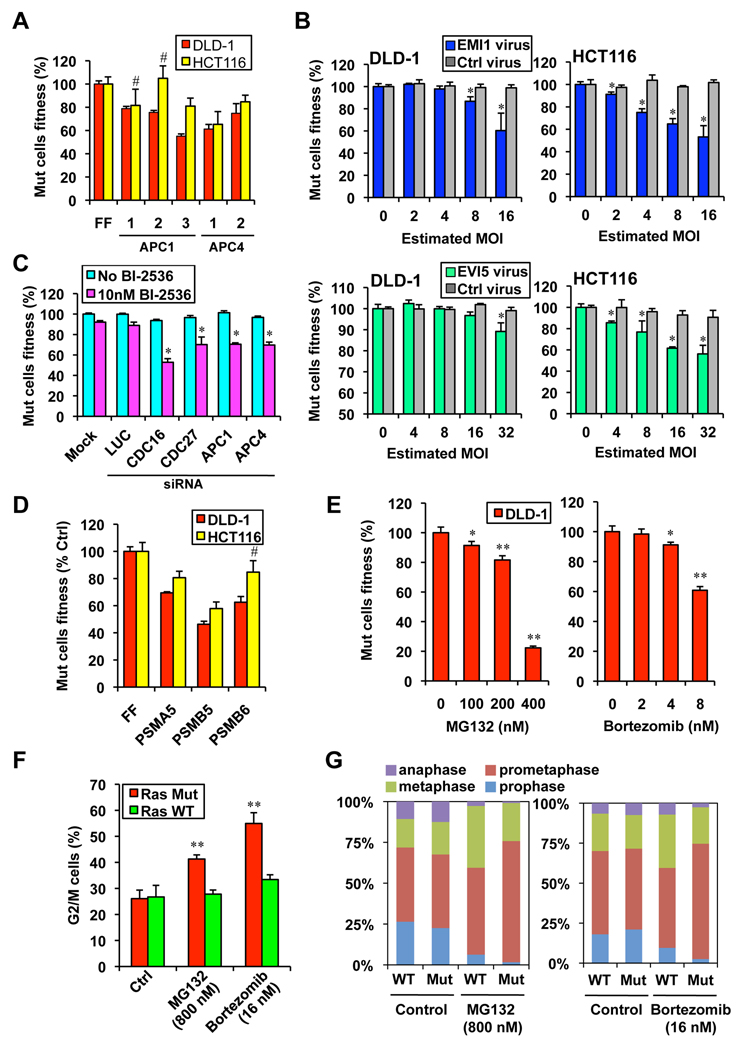
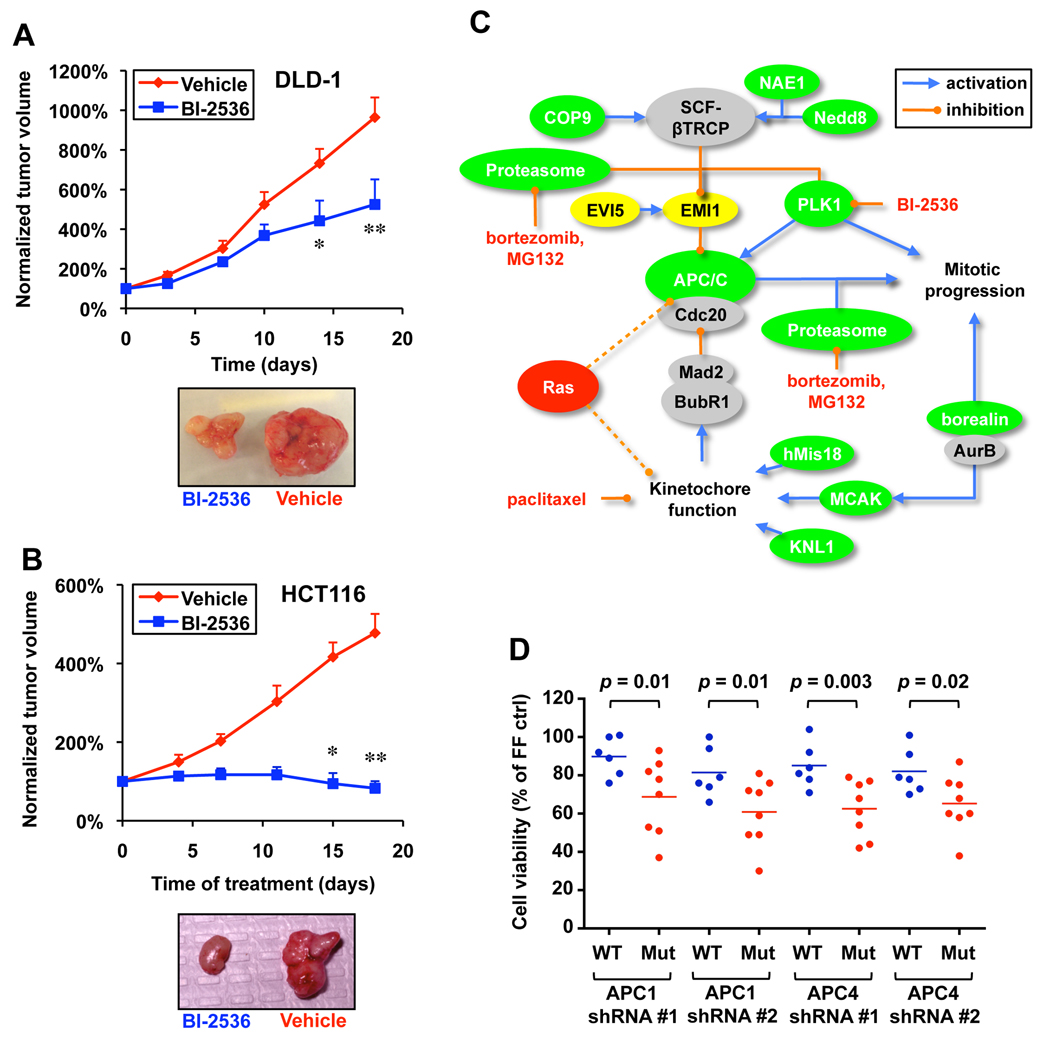
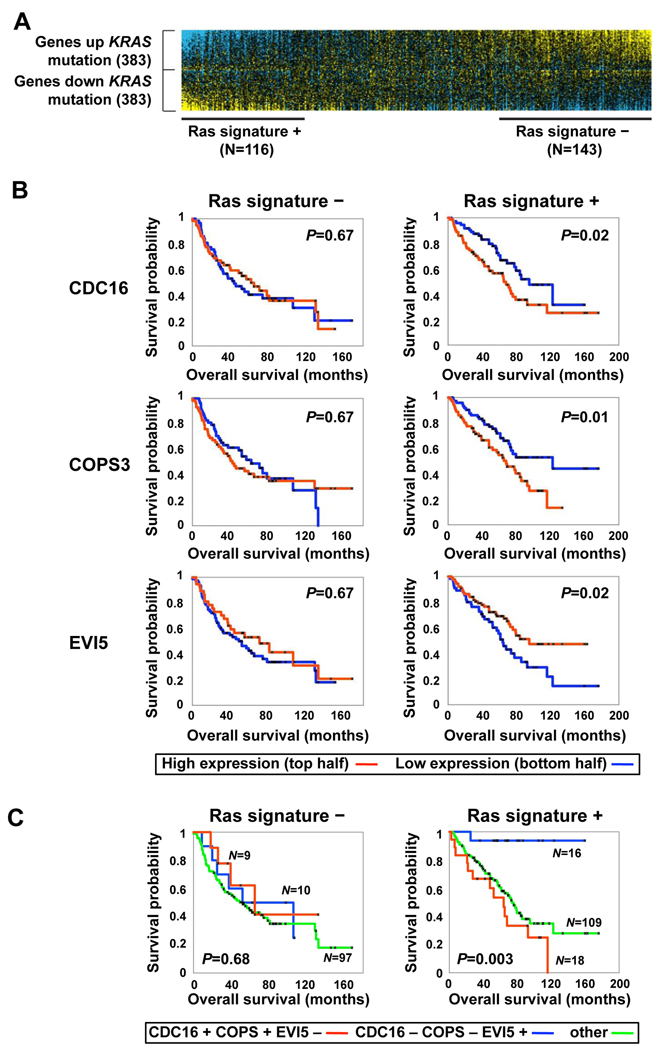
Oncogenic mutations in the small GTPase Ras are highly prevalent in cancer, but an understanding of the vulnerabilities of these cancers is lacking. We undertook a genome-wide RNAi screen to identify synthetic lethal interactions with the KRAS oncogene. We discovered a diverse set of proteins whose depletion selectively impaired the viability of Ras mutant cells. Among these we observed a strong enrichment for genes with mitotic functions. We describe a pathway involving the mitotic kinase PLK1, the anaphase-promoting complex/cyclosome, and the proteasome that, when inhibited, results in prometaphase accumulation and the subsequent death of Ras mutant cells. Gene expression analysis indicates that reduced expression of genes in this pathway correlates with increased survival of patients bearing tumors with a Ras transcriptional signature. Our results suggest a previously underappreciated role for Ras in mitotic progression and demonstrate a pharmacologically tractable pathway for the potential treatment of cancers harboring Ras mutations.


Figures

Figure 1
Figure 1. Scheme of the Ras synthetic lethal screen
A. Schematic of the primary screen. Change in a particular shRNA’s abundance in the pool over time is tracked by competitive hybridization between the initial (PD 0) and final samples (PD 17). A low Cy3/Cy5 ratio indicates the dropout of an anti-proliferative shRNA from the pool. Synthetic lethal shRNAs are selectively depleted from the Ras Mut cells. PD, population doubling; HH, half-hairpin. B. MAPK pathway activity in DLD-1 cells. Phosphorylation on p42/p44 Erk kinases in cells that were either in full media, serum starved overnight, or serum-starved and then stimulated with full media. C. Growth curve of DLD-1 cells in culture. D. Anchorage independence colony formation of DLD-1 cells in soft-agarose, assessed 2 weeks after seeding. E. Schematic of the competition assay used to validate shRNAs from the primary screen. Ras Mut cells expressing GFP and Ras WT cells were mixed and co-infected with the same retroviral shRNA. The Mut to WT cell ratio at the end of the experiment is measured by FACS. The percentage of Ras Mut cells in the mixture infected with a candidate RSL shRNA was normalized against that of a control shRNA targeting firefly luciferase (FF).
Figure 2
Figure 2. Functional diversity of candidate RSL genes
A. Functional classification of candidate RSL genes in Supplemental Table 3 based on biological processes as annotated in PANTHER. The P-value denotes selective enrichment for genes in the corresponding biological process. B. Validation of candidate RSL genes with multiple shRNAs using the competition assay. FF, negative control shRNA targeting firefly luciferase (for each shRNA p< 0.01 compared to the respective FF control, except cases marked with * which have p<0.05). Error bars indicate standard deviations in all figures unless otherwise indicated.
Figure 3
Figure 3. Hypersensitivity of Ras Mut cells to mitotic stress
A. Examples of mitotic genes with multiple shRNAs showing synthetic lethality with mutant Ras (for each shRNA p< 0.01 compared to the respective FF control, except * p<0.05 and # not significant). B. Mitotic index in asynchronous DLD-1 cells growing in log-phase as measured by phospho-H3 Ser10 staining (* p<0.05). C. Ras Mut DLD-1 cells show a higher frequency of abnormal anaphases (lagging chromosomes) 40 minutes after released from the metaphase block by monastrol (* p<0.05). An example of Ras Mut cell with a lagging chromosome (arrowhead) is shown. D. The microtubule stabilizer paclitaxel selectively decrease the fitness of Ras Mut cells in a dose dependent fashion. The competition assay was carried out in the presence of paclitaxel for 5 days (* p<0.05, ** p<0.01 compared to untreated samples). E. Paclitaxel preferentially induces the G2 and mitotic accumulation of Ras Mut DLD-1 cells as assessed by FACS using DNA and phospho-H3 Ser10 staining, respectively (** p<0.01). F. Paclitaxel causes strong prometaphase arrest in mitotic DLD-1 Ra Mut cells (shown are mean values of independent triplicates).
Figure 4
Figure 4. Hypersensitivity of Ras Mut cells to PLK1 inhibition
A. PLK1 depletion by shRNA leads to enhanced toxicity in Ras Mut cells (for each shRNA p< 0.01 compares to respective FF control, except * p<0.05). B. The PLK1 inhibitor BI-2536 selectively decreases the fitness of Ras Mut cells in a dose-dependent fashion. The competition assay was carried out in the presence of BI-2536 for 5 days (* p<0.05, ** p<0.01 compared to untreated samples). C. Effect of synthetic lethal concentrations of BI-2536 on cell cycle distribution of Ras Mut and Ras WT DLD-1 cells after 26 hours of treatment. Cell cycle profiles shown are representative of 3 experiments. D. BI-2536 causes strong prometaphase arrest in mitotic DLD-1 Ras Mut cells (shown are mean values of independent triplicates). E. BI-2536 does not differentially affect mitotic entry in DLD-1 Ras Mut and WT cells. Cells synchronized at G2/M by RO-3306 were released into nocodazole (100 ng/ml) together with indicated concentrations of BI-2536 for 1 hour. Mitotic index was measured as the percentage of cells staining positive for phospho-H3 Ser10. NR, no release. F. BI-2536 differentially affects mitotic progression in DLD-1 Ras Mut and WT cells. Mitotic cells collected by nocodazole shake-off were released into indicated concentrations of BI-2536 for 2 hours. Mitotic index was measured as above (* p<0.05, ** p<0.01 compared to samples without BI-2536 treatment). NR, no release. G. Effect of BI-2536 (25 nM) on cell cycle distribution of DLD-1 Ras Mut and WT cells over a 48-hour period (* p<0.05, ** p<0.01).
Figure 5
Figure 5. Ras Mut cells are hypersensitive to APC/C and proteasome inhibition
A. Multiple shRNAs against APC1 and APC4 confer synthetic lethality in Ras Mut cells as measured by the competition assay (for each shRNA p< 0.05 compared to respective FF control, except # not significant). B. Over expression of the APC/C inhibitor EMI1 and its binding protein EVI5 selectively impair the viability of Ras Mut cells days (* p<0.05 compared to uninfected samples). C. siRNA mediated knockdown of APC/C subunits synergizes with low concentration of BI-2536 to selectively impair the viability of DLD-1 Ras Mut cells as measured by the competition assay. Cells were transfected with pools of 4 siRNAs against each gene, 2 days post transfection cells were treated with 10 nM of BI-2536 for 3 days before analysis by FACS (* p<0.05 compared to untransfected samples in the sample treatment group). D. shRNAs targeting various proteasome subunits exhibit synthetic lethality in Ras Mut cells (for each shRNA p< 0.05 compared to respective FF control). E. The proteasome inhibitors MG132 and bortezomib selectively decreased the fitness of DLD-1 Ras Mut cells in a dose dependent fashion over 4 days (* p<0.05,** p<0.01 compared to untreated samples). F. MG132 and bortezomib preferentially induce the accumulation of Ras Mut DLD-1 cells as assessed by FACS using staining (** p<0.01 compared to samples without drug treatment). G. MG132 and bortezomib cause strong prometaphase arrest in mitotic DLD-1 Ras Mut cells (shown are mean values of independent triplicates).
Figure 6
Figure 6. A model of mitotic regulation by Ras
A. BI-2536 attenuates DLD-1 tumor growth in vivo. Intravenous injection of BI-2536 started 1 week after subcutaneous injection of DLD1 cells. Tumor volume at each time point was normalized to the initial tumor volume (* p<0.05 and ** p<0.01, 2-way ANOVA, error bars indicate S.E.M.). Representative images of tumors after treatment are shown. B. BI-2536 attenuates HCT116 tumor growth in vivo. Treatment of HCT116 xenografts was similar to that described for DLD-1 tumors (* p<0.05 and ** p<0.01, 2-way ANOVA, error bars indicate S.E.M.). C. A model in which oncogenic Ras introduces mitotic stress that can be exacerbated to produce lethality by interfering with kinetochore and APC/C function. Genes shaded green are RSL genes, while yellow genes cause Ras-specific lethality when overproduced. Dotted lines illustrate hypothetical connections between Ras and aspects of mitotic regulation leading to mitotic stress. D. Sensitivity of a panel of NSCLCs to APC/C shRNAs. NSCLCs with endogenous Ras mutations (H23, H358, H647, H1299, H1734, H2030, H2122 and H2228) and without Ras mutations (H522, H838, H1437, H1650, H1838 and H1975) were infected with shRNAs against APC1 or APC4. Cell viability was compared to control FF shRNA infected samples 6 days post infection.
Figure 7
Figure 7. Candidate RSL genes associated with prognosis in human lung adenocarcinomas showing activation of the Ras pathway
A. A gene expression signature for lung cancers with activated Ras pathway. A previously derived gene expression signature (766 genes) of KRAS mutant versus wild-type lung tumors was used as a probe in an additional set of expression profiles from 442 human lung adenocarcinomas. Both tumors with significant (P<0.01) similarity or dissimilarity to the KRAS signature (“Ras signature +” and “Ras signature –” tumors, respectively) were considered for subsequent survival analyses. B. RSL pathway genes that correlate with prognosis among “Ras signature+” tumors. The expression of two RSL genes, COPS3 and CDC16, are inversely correlated with better survival whereas expression of EVI5 correlates with better survival (P<0.05, both log-rank and Cox, log-rank P-values shown). Within each of the two tumor subsets considered (“Ras signature +” and “Ras signature −”), tumors with expression levels for the given gene greater than the median (red line) were compared to the rest of the tumors in the subset (blue line), using Kaplan-Meier analysis. C. Prognosis in “Ras signature +” and “Ras signature −” tumors using combined information from COPS3CDC16, and EVI5. For each of the three genes, “+” and “−” is relative to their median expression across the subset of tumors. Within each of the two tumor subsets, three tumor groups were compared by Kaplan-Meier analysis: tumors with high CDC16, high COPS3, and low EVI5 (“CDC16+ COPS3+ EVI−”); tumors with low CDC16, low COPS3, and high EVI5 (“CDC16COPS3EVI+”); and tumors not falling into these two groups (“other”). Log-rank P-values indicate significant differences among any of the three groups.

Comment in

Similar articles

Cited by

References

    1. Barr FA, Sillje HH, Nigg EA. Polo-like kinases and the orchestration of cell division. Nat Rev Mol Cell Biol. 2004;5:429–440. - PubMed
    1. Bezieau S, Devilder MC, Avet-Loiseau H, Mellerin MP, Puthier D, Pennarun E, Rapp MJ, Harousseau JL, Moisan JP, Bataille R. High incidence of N and K-Ras activating mutations in multiple myeloma and primary plasma cell leukemia at diagnosis. Hum Mutat. 2001;18:212–224. - PubMed
    1. Bhattacharjee A, Richards WG, Staunton J, Li C, Monti S, Vasa P, Ladd C, Beheshti J, Bueno R, Gillette M, et al. Classification of human lung carcinomas by mRNA expression profiling reveals distinct adenocarcinoma subclasses. Proc Natl Acad Sci U S A. 2001;98:13790–13795. - PMC - PubMed
    1. Cope GA, Deshaies RJ. COP9 signalosome: a multifunctional regulator of SCF and other cullin-based ubiquitin ligases. Cell. 2003;114:663–671. - PubMed
    1. Denko NC, Giaccia AJ, Stringer JR, Stambrook PJ. The human Ha-ras oncogene induces genomic instability in murine fibroblasts within one cell cycle. Proc Natl Acad Sci U S A. 1994;91:5124–5128. - PMC - PubMed

Publication types

MeSH terms