. 2009 Jun 9;106(23):9435-40.
doi: 10.1073/pnas.0900571106. Epub 2009 May 28.

The tyrosine phosphatase PTPRD is a tumor suppressor that is frequently inactivated and mutated in glioblastoma and other human cancers

Affiliations

The tyrosine phosphatase PTPRD is a tumor suppressor that is frequently inactivated and mutated in glioblastoma and other human cancers

Selvaraju Veeriah et al. Proc Natl Acad Sci U S A. .

Abstract

Tyrosine phosphorylation plays a critical role in regulating cellular function and is a central feature in signaling cascades involved in oncogenesis. The regulation of tyrosine phosphorylation is coordinately controlled by kinases and phosphatases (PTPs). Whereas activation of tyrosine kinases has been shown to play vital roles in tumor development, the role of PTPs is much less well defined. Here, we show that the receptor protein tyrosine phosphatase delta (PTPRD) is frequently inactivated in glioblastoma multiforme (GBM), a deadly primary neoplasm of the brain. PTPRD is a target of deletion in GBM, often via focal intragenic loss. In GBM tumors that do not possess deletions in PTPRD, the gene is frequently subject to cancer-specific epigenetic silencing via promoter CpG island hypermethylation (37%). Sequencing of the PTPRD gene in GBM and other primary human tumors revealed that the gene is mutated in 6% of GBMs, 13% of head and neck squamous cell carcinomas, and in 9% of lung cancers. These mutations were deleterious. In total, PTPRD inactivation occurs in >50% of GBM tumors, and loss of expression predicts for poor prognosis in glioma patients. Wild-type PTPRD inhibits the growth of GBM and other tumor cells, an effect not observed with PTPRD alleles harboring cancer-specific mutations. Human astrocytes lacking PTPRD exhibited increased growth. PTPRD was found to dephosphorylate the oncoprotein STAT3. These results implicate PTPRD as a tumor suppressor on chromosome 9p that is involved in the development of GBMs and multiple human cancers.


Conflict of interest statement

The authors declare no conflict of interest.

Figures
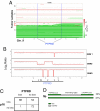
Fig. 1.
Fig. 1.
Deletion of PTPRD in GBM. (A) aCGH profile analysis of 215 GBM tumors from TCGA (4/14/2008 data freeze). Segmentation data for the area surrounding PTPRD on chromosome 9p is shown. Tumors are sorted by amount of loss at the PTPRD locus for convenient viewing. Chromosomal gain or loss is represented by a color gradient (red, gain; green, loss). x axis represents genomic location along chromosome 9p (Mbps). The blue bars represent the boundaries of the PTPRD gene. Red bracket marks tumors that possess intragenic deletions of PTPRD. (B) PTPRD is subject to focal, intragenic deletions. Shown are aCGH profiles of selected tumors with intragenic deletions of PTPRD. Probes are plotted along chromosome 9p according to log2 ratio. The red line represents averaged log2 ratio trend. The black arrows show PTPRD exons encompassed by intragenic deletions. (C) Frequency of loss of PTPRD and p16INK4A. Loss is defined as a log2 ratio less than −0.25 to −2.00. Coordinate loss of both genes is indicated. (D) Diagram depicting the nature of loss events in the genomic region encompassing PTPRD and p16INK4A. Depicted is a summary of data generated from analysis of aCGH data. Shown is the region of chromosome 9p in which PTPRD (9p23–24) and p16INK4A (9p21) are located, as well as the intervening DNA. Black bars do not represent exact borders but serve only to summarize the data. Green represents loss of copy number and white represents euploidy. Thirty-three percent occur as a result of two distinct loss events separated by intervening DNA which is euploid (no CNA).
Fig. 2.
Fig. 2.
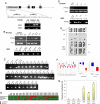
PTPRD is subject to frequent epigenetic silencing in GBM. (A) Shown is promoter structure of the PTPRD gene (Top). Numbered boxes denote exons and TIS denotes the transcriptional start site. Two independent MSP assays were developed to detect hypermethylated PTPRD and both produce identical results (Bottom). IVD, in vitro methylated genomic DNA; SKMG3, GBM cell line; NB, normal brain. U denotes the presence of unmethylated alleles and M denotes the presence of methylated alleles. The locations assayed by RT-PCR and MSP are noted. (B) Epigenetic silencing of PTPRD expression caused by hypermethylation. Results are shown for RT-PCR (Top) and MSP (Bottom). PTPRD is silenced and hypermethylated in the GBM cell line SKMG3. After treatment with the DNMT inhibitor DAC, PTPRD becomes demethylated and expression is restored. (C) Frequent hypermethylation of PTPRD in primary GBM tumors. Double knockout (DKO), control for unmethylated PTPRD alleles derived from a cell line in which DNMT1 and 3b were knocked out (44). MDA-MB 213 was previously found to undergo silencing of PTPRD and is used as a positive control for methylated alleles (4). (D) Loss of PTPRD expression in primary GBM tumors with hypermethylated PTPRD. Representative samples are shown. (E) Bisulfite sequencing of the PTPRD promoter. Black circles represent methylated CpG dinucleotides. White circles represent unmethylated CpG dinucleotides. (F) Decreased expression of PTPRD in malignant glioma is associated with poor clinical prognosis. Left shows representative data across multiple independently published microarray datasets. Datasets used are labeled. P values for significance are shown. Each pair of plots denotes normalized expression for normal brain (NB, blue) versus glioma (G, red). Shaded boxes = 25th–75th percentile. Whiskers = 10th–90th percentile, and asterisks represent range. Bars = median. Middle and Right show box plots demonstrating decreased PTPRD expression in gliomas with increasing WHO grade and those with poorer survival. All datasets were analyzed as previously described (23) and are listed in Table S1. The second and third graphs, Shia dataset (Table S1). (G) PTPRD is methylated in several primary human cancers, but not in corresponding normal tissues. Methylation was detected by MSP and confirmed with bisulfite sequencing. The data from colon and breast cancer described in our previous study are shown here to enable comparison with methylation frequencies in GBM (4). (H) Concordance analysis of genomic and epigenomic inactivation of PTPRD and p16INK4A. Map shows the presence (red) or absence (green) of both loss and epigenetic inactivation in p16INK4A and PTPRD, in the same tumor set. Analysis of copy number was performed with genomic qPCR and methylation was performed with MSP.
Fig. 3.
Fig. 3.
Tumor suppressive properties of PTPRD. (A) Immunoblot showing HEK 293T cells transfected with wild-type PTPRD cDNA, vector alone (pcDNA 3.1-V5), PTPRD + shRNA targeting PTPRD, and PTPRD + scrambled shRNA. Antibody against the V5 epitope (Invitrogen) was used to detect the PTPRD-V5 fusion protein. Actin was used as a loading control. (B) Expression of PTPRD suppresses growth of human cancer cells. PTPRD was transfected into the cell lines indicated, and the cells were cultured for 2 weeks in media containing G418. (C) shRNA knockdown of PTPRD expression in primary human astrocytes. Expression was measured using quantitative PCR. Results normalized to GAPDH. Assay was performed in triplicate. (D) Knockdown of PTPRD in IHA results in increased growth rate. Left shows cultures of either astrocytes with PTPRD knocked down or control cells (scramble) plated at equal cell numbers and cultured for 10 days. Right shows a growth curve comparing rate of proliferation of astrocytes with PTPRD knocked down versus control. Five thousand cells were plated in both cases. All experiments were performed in triplicate. All graphs report mean ± SD. *, P < 0.05; ***, P < 0.001. (E) PTPRD depletion results in increased tumor growth. Immortalized human astrocytes (IHA) expressing shRNA that depleted PTPRD resulted in faster tumor growth than a scrambled control in a mouse xenograft model. The astrocytes used were immortalized by transfection with E6, E7, hTERT, and ras (25). Error bars show ± SD. P < 0.05 for all comparisons of PTPRD shRNA versus astrocytes alone and scramble shRNA. (F) PTPRD mutations found in human cancers abrogate growth suppressive properties. Top shows the mutations that were tested. Shown are bright field pictures and colony formation assays of HCT116 cells transfected with empty vector, wild-type PTPRD, and the 3 mutant PTPRD alleles indicated. PTPc, phosphatase domain; FN3, fibronectin type III domain; IGC2, Ig C2 domain. (G) PTPRD dephosphorylates and regulates STAT3. Left shows the levels of phospho and total proteins indicated after wild-type and mutant PTPRD transfection into HEK 293T cells. Top Right shows blot demonstrating that PTPRD directly dephosphorylates STAT3 in vitro. GST-PTPRD fusion protein (1–20 μg) was incubated with immunoprecipitated STAT3-Flag and analyzed by Western blot. Bottom Right bar graph shows that SOCS3 mRNA levels decrease after wild-type PTPRD transfection. Values represent normalized expression measured using qPCR. **, P = 0.0019). (H) Knockdown of PTPRD increases the phosphorylation of STAT3. siRNA was used to knockdown PTPRD in the indicated cells. PTPRD was detected by Western blot using an anti-PTPRD antibody. Total STAT3 and phospho-STAT3 were detected as above. (I) Summary of PTPRD alterations in primary human cancers. The presence of a type of alteration as detected in the current study is denoted by red. Number indicates observed frequency of event. Green indicates evidence of the event in the literature (4, 11, 12, 44, 45).

Similar articles

Cited by

References

    1. Blume-Jensen P, Hunter T. Oncogenic kinase signalling. Nature. 2001;411:355–365. - PubMed
    1. Futreal PA, et al. A census of human cancer genes. Nat Rev Cancer. 2004;4:177–183. - PMC - PubMed
    1. Ponder BA. Cancer genetics. Nature. 2001;411:336–341. - PubMed
    1. Chan TA, et al. Convergence of mutation and epigenetic alterations identifies common genes in cancer that predict for poor prognosis. PLoS Med. 2008;5:823–838. - PMC - PubMed
    1. Ostman A, Hellberg C, Bohmer FD. Protein-tyrosine phosphatases and cancer. Nat Rev Cancer. 2006;6:307–320. - PubMed

Publication types

MeSH terms

Substances

LinkOut - more resources