. 2009 May 28;62(4):578-92.
doi: 10.1016/j.neuron.2009.03.028.

Inhibitory stabilization of the cortical network underlies visual surround suppression

Affiliations

Inhibitory stabilization of the cortical network underlies visual surround suppression

Hirofumi Ozeki et al. Neuron. .

Abstract

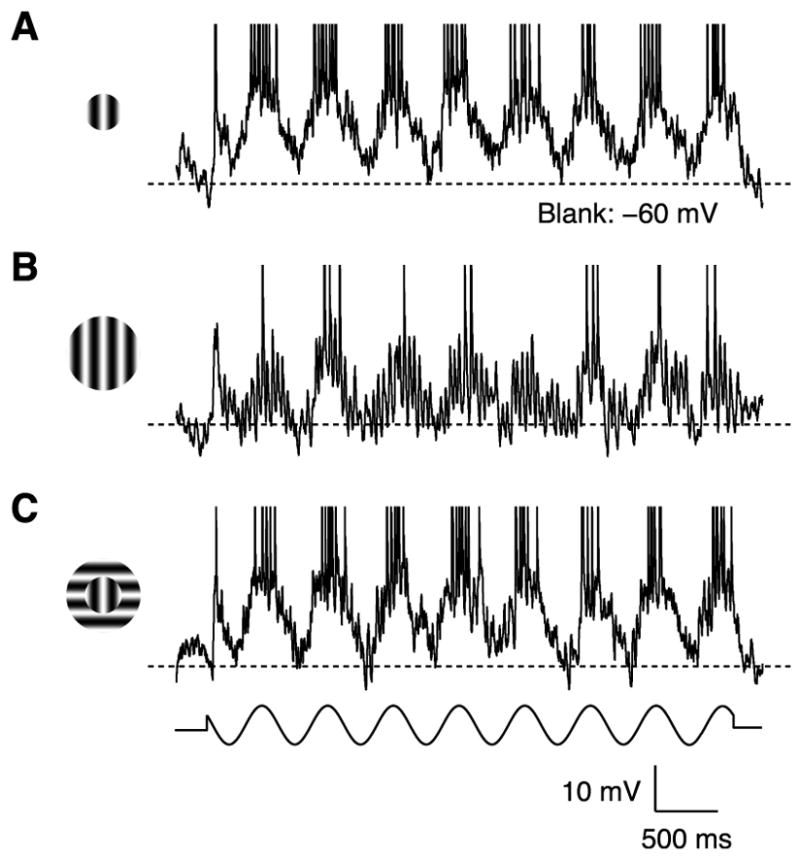
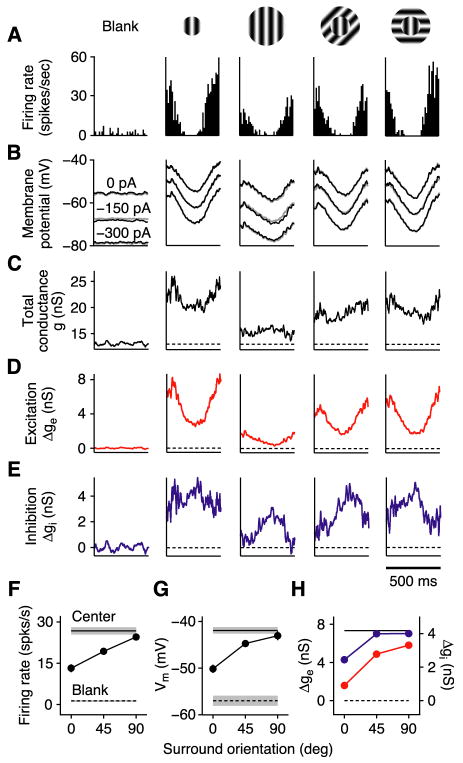
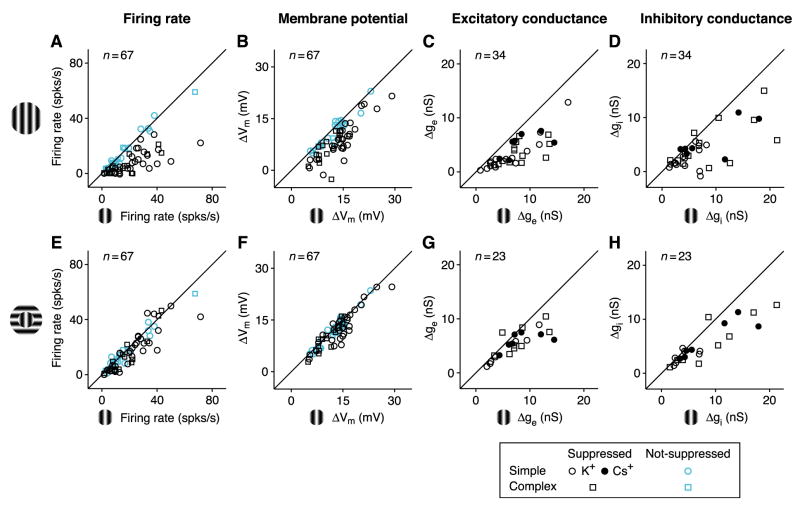
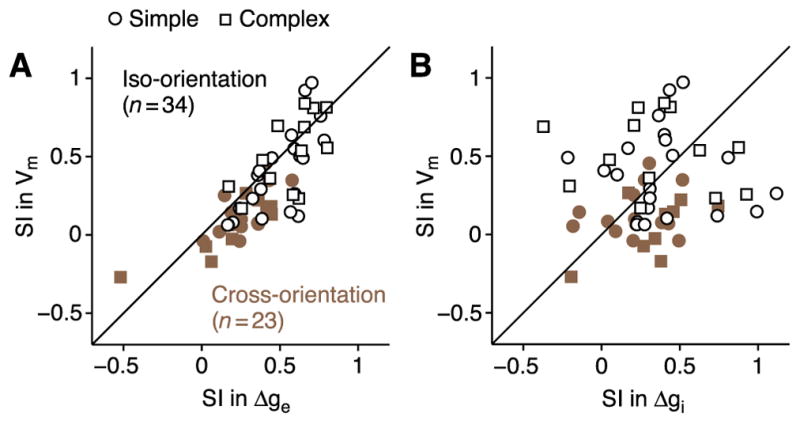
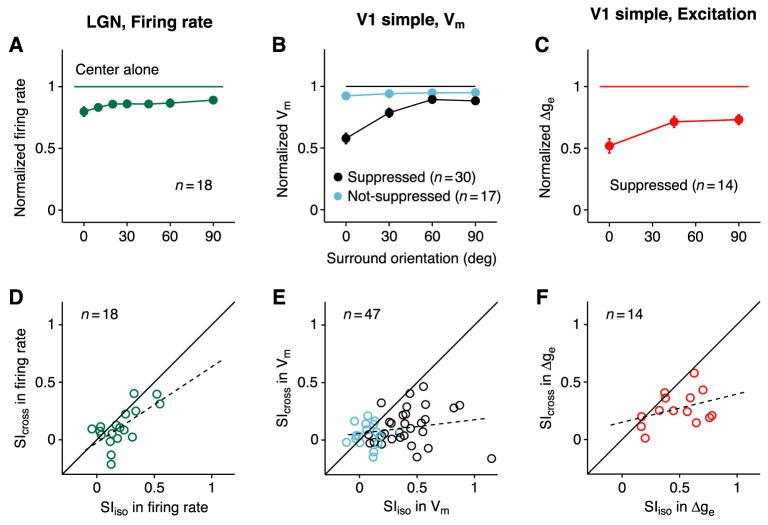
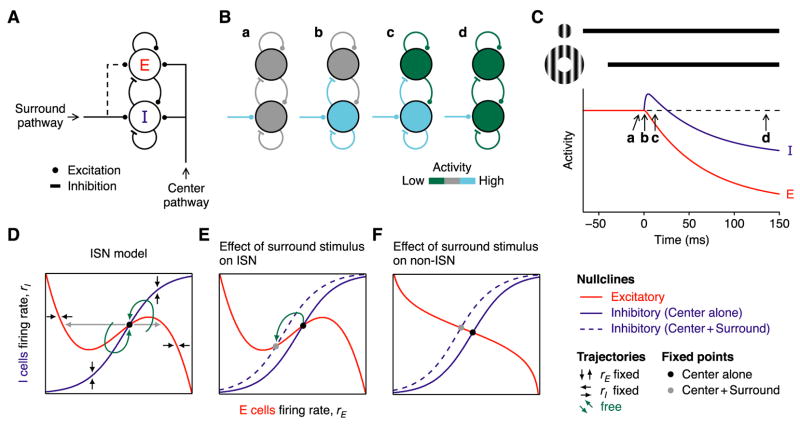
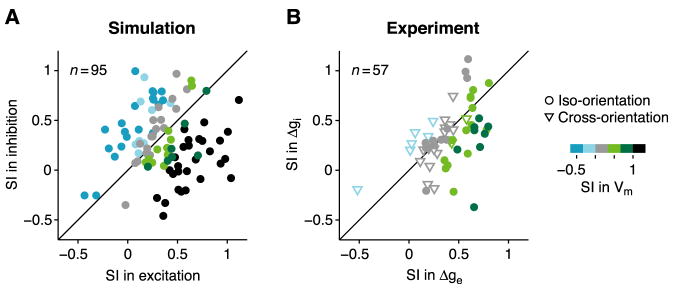
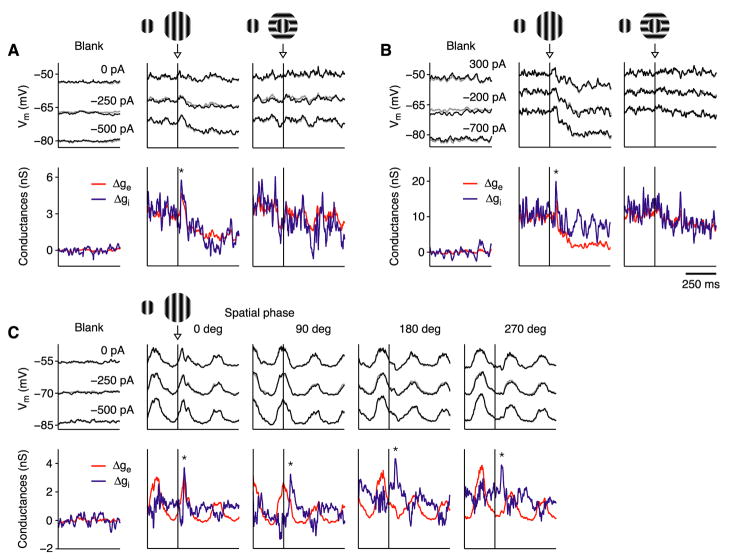
In what regime does the cortical circuit operate? Our intracellular studies of surround suppression in cat primary visual cortex (V1) provide strong evidence on this question. Although suppression has been thought to arise from an increase in lateral inhibition, we find that the inhibition that cells receive is reduced, not increased, by a surround stimulus. Instead, suppression is mediated by a withdrawal of excitation. Thalamic recordings and previous work show that these effects cannot be explained by a withdrawal of thalamic input. We find in theoretical work that this behavior can only arise if V1 operates as an inhibition-stabilized network (ISN), in which excitatory recurrence alone is strong enough to destabilize visual responses but feedback inhibition maintains stability. We confirm two strong tests of this scenario experimentally and show through simulation that observed cell-to-cell variability in surround effects, from facilitation to suppression, can arise naturally from variability in the ISN.


Figures

Figure 1
Figure 1. Membrane potential responses of a surround-suppressed simple cell to drifting grating stimuli
(A) A grating optimal in size, orientation and spatial frequency covered the classical receptive field (2°s diameter, 2 Hz temporal frequency, 64% contrast). K+-gluconate solution in the recording pipette. Dashed line: mean response to a blank stimulus. (B) The grating diameter was increased to cover the receptive field surround (20°s diameter). (C) The portion of the grating covering the receptive field surround was rotated orthogonal to the cell’s preferred orientation.
Figure 2
Figure 2. Steady-state measurements of surround suppression in V1
(A) Cycle-averaged spike responses of a simple cell to a blank stimulus, a center-only stimulus, and center-plus-surround stimuli with 3 different surround orientations. K+-gluconate solution in the recording pipette. (B) Cycle-averaged membrane potential responses (spikes removed) with 3 different levels of injected current. Gray traces (barely visible): membrane potential reconstructed from conductance measurements. (C–E) Stimulus-evoked changes in total membrane conductance and excitatory and inhibitory conductances derived from responses in (B). Dashed lines: mean of the blank responses. (F–H) Firing rate (F1 component), peak membrane potential (DC+F1), and peak excitatory (red) and inhibitory (blue) conductances (DC+F1) vs. surround orientation (relative to center). Error bars (s.e.m.) are barely visible. Horizontal lines: Blank and center-only responses (shading = s.e.m.).
Figure 3
Figure 3. Surround suppression across the V1 population
(A–D). Center-plus-surround response amplitude (surround at preferred orientation) plotted against center-only response amplitude for (A) firing rate (F1 component for 47 simple cells; DC component for 20 complex cells), (B) change in peak membrane potential, (C) change in peak excitatory conductance (21 simple; 13 complex), and (D) change in peak inhibitory conductance. For each graph, responses are measured relative to blank responses. Round and square symbols: simple and complex cells; open and closed symbols: K+–based or Cs+-based/QX-314 solution in recording pipette. In (A) and (B), cyan symbols indicate cells that showed no statistically significant suppression (17 simple, 6 complex). (E–H) Same as (A)-(D), but with surround at the orthogonal orientation. (E) and (F), same population as (A) and (B); (G) and (H), 14 simple and 9 complex cells.
Figure 4
Figure 4. The relationship between surround suppression in membrane potential and synaptic conductance
(A) Suppression index (SI = 1 − Rcenter+surround/Rcenter) for membrane potential plotted against SI for excitatory conductance. Open symbols: surround at preferred orientation (21 simple; 13 complex); closed symbols: surround at the orthogonal orientation (17 simple; 6 complex). (B) Same as (A) for inhibitory conductance.
Figure 5
Figure 5. Comparison of surround suppression in LGN and V1
(A) Orientation-tuning of firing rate for 7 surround orientations (relative to center orientation), normalized to the center-only response and averaged across 18 LGN cells. The size of the center stimulus was optimal for cortical cells, and not for LGN cells (see text). Normalized responses to iso-oriented and cross-oriented surround (mean ± s.e.m.): 0.80 ± 0.04 and 0.89 ± 0.03. (B) Orientation-tuning curve of membrane potential, normalized and averaged across V1 simple cells. Black and cyan indicate surround suppressed and non-suppressed cells. Center-normalized responses to iso-oriented and cross-oriented surround: suppressed, 0.58 ± 0.04 and 0.88 ± 0.03; non-suppressed, 0.92 ± 0.03 and 0.95 ± 0.02. (C) Excitatory conductance in surround-suppressed simple cells. Center-normalized responses: iso-oriented surround, 0.52 ± 0.06; cross-oriented surround, 0.73 ± 0.04. (D–F) Suppression indices (SI) for iso- and cross-oriented surround plotted against one another. (D) Firing rate in LGN cells. (E) Membrane potential in surround-suppressed (black, n=30) and non-suppressed (cyan, n=17) simple cells. (F) Excitatory conductance in surround-suppressed simple cells. Dashed lines: linear regressions.
Figure 6
Figure 6. An inhibition-stabilized network model of surround suppression
(A) Two populations of cells, excitatory (E) and inhibitory (I), make recurrent and reciprocal connections. Each receives excitatory feed-forward input driven by the receptive field center and lateral excitatory input driven by the receptive field surround. (B) The sequence of events that follow when a surround stimulus (cyan; assumed for simplicity to stimulate only I cells) is added to a pre-existing center stimulus (not shown). After a transient increase in the activity of the I cells (b, c), activity in both the E and I cells decreases (d) relative to the initial level evoked by center stimulus alone (a). (C) The temporal sequence of changes in E and I cell activities (red and blue). (D and E) Phase-plane diagram of the network activity (D) in the presence of the center stimulus and (E) when the surround stimulus is added (dotted line). (F) Same as (E) for a non-ISN.
Figure 7
Figure 7. Surround effects in a multi-neuron ISN model
(A) Suppression indices (SI; iso-oriented surround) of excitation and inhibition plotted against one another for 100 randomly-chosen neurons from a multi-neuron ISN model. Five cells fall outside the plot. Colors code SI of membrane potential. (B) Experimentally measured SI’s of excitatory and inhibitory conductance plotted against one another (data from Figure 4). Circles and triangles: surround effects at iso- and cross-orientation. In the model, cells have SI > 1 for membrane potential (A, black points, meaning surround suppresses response below baseline) whenever total inhibition evoked by center-plus-surround stimulus exceeds total excitation. In real neurons, reversal-potential nonlinearities can suppress effects of inhibition on membrane potential so that SI remains <1.
Figure 8
Figure 8. Transient increase in inhibitory conductance
Responses of cells to sudden addition of a surround stimulus (arrows) to a center stimulus that began 500 ms earlier (250 ms before traces start). The iso-oriented surround is presented at the same phase as the center. Gratings drifted at 4Hz. Black, membrane potential recorded with different currents injected; red and blue, changes in excitatory and inhibitory conductance; gray, reconstruction of membrane potential from derived conductances. K+-gluconate solution in recording pipette. (A and B) Responses of 2 complex cells. A transient increase in conductance (asterisks) occurred in response to iso-oriented but not cross-oriented surround. (C) Simple cell tested with iso-oriented surround added at 4 different response phases (starting center phase shifted by 90° for each successive stimulus). All evoked transient increase in conductance.
Figure 9
Figure 9. Comparison of population data with predictions of the ISN model
(A) Suppression indices of membrane potential for the iso-oriented surround (SIiso) in 47 simple cells (30 surround-suppressed; 17 non-suppressed) plotted against cortical input index (CII), which correlates well with percent of excitatory input received from cortex (vs. LGN), see text. Only cells with CII>0.2 (vertical dashed line), suggesting >20% cortical input, show strong suppression. Arrow shows mean SIiso for 18 LGN cells, which is comparable to mean values for cortical cells with little cortical input and for non-suppressed cortical cells. (B) Same as (A) for orientation selectivity of suppression (SIiso–SIcross), the difference between suppression induced by iso- and cross-oriented surrounds. Arrow shows mean value of SIiso–SIcross for 18 LGN cells. (C and D) SIiso and SIiso–SIcross for membrane potential plotted against latency of response to electrical stimulation of the LGN (C, 13 simple, 10 complex; D, 13 simple, 5 complex). Cells with short latencies (<2.3 ms) receive some excitation directly from LGN; cells with long latencies (>2.8 ms) receive no monosynaptic input from LGN. Regression lines are derived from surround-suppressed cells only. Arrows as in (A) and (B). In (A)-(D): circle and square symbols, simple and complex cells; black and cyan symbols, surround-suppressed and non-suppressed cells.

Similar articles

Cited by

References

    1. Adini Y, Sagi D, Tsodyks M. Excitatory-inhibitory network in the visual cortex: psychophysical evidence. Proc Natl Acad Sci USA. 1997;94:10426–10431. - PMC - PubMed
    1. Akasaki T, Sato H, Yoshimura Y, Ozeki H, Shimegi S. Suppressive effects of receptive field surround on neuronal activity in the cat primary visual cortex. Neurosci Res. 2002;43:207–220. - PubMed
    1. Amit DJ, Brunel N. Model of global spontaneous activity and local structured activity during delay periods in the cerebral cortex. Cereb Cortex. 1997;7:237–252. - PubMed
    1. Anderson JS, Carandini M, Ferster D. Orientation tuning of input conductance, excitation, and inhibition in cat primary visual cortex. J Neurophysiol. 2000;84:909–926. - PubMed
    1. Anderson JS, Lampl I, Gillespie DC, Ferster D. Membrane potential and conductance changes underlying length tuning of cells in cat primary visual cortex. J Neurosci. 2001;21:2104–2112. - PMC - PubMed

Publication types

LinkOut - more resources