. 2009 May 28;62(4):555-65.
doi: 10.1016/j.neuron.2009.04.018.

Inhibitory regulation of electrically coupled neurons in the inferior olive is mediated by asynchronous release of GABA

Affiliations

Inhibitory regulation of electrically coupled neurons in the inferior olive is mediated by asynchronous release of GABA

Aaron R Best et al. Neuron. .

Abstract

Inhibitory projection neurons in the deep cerebellar nuclei (DCN) provide GABAergic input to neurons of the inferior olive (IO) that in turn produce climbing fiber synapses onto Purkinje cells. Anatomical evidence suggests that DCN to IO synapses control electrical coupling between IO neurons. In vivo studies suggest that they also control the synchrony of IO neurons and play an important role in cerebellar learning. Here we describe the DCN to IO synapse. Remarkably, GABA release was almost exclusively asynchronous, with little conventional synchronous release. Synaptic transmission was extremely frequency dependent, with low-frequency stimulation being largely ineffective. However, due to the prominence of asynchronous release, stimulation at frequencies above 10 Hz evoked steady-state inhibitory currents. These properties seem ideally suited to transform the firing rate of DCN neurons into sustained inhibition that both suppresses the firing of IO cells and regulates the effective coupling between IO neurons.


Figures
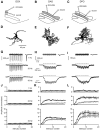
Figure 1
Figure 1. Inferior olive (IO) neurons receive GABAergic synapses with unusual slow properties
A-C, Schematics of slice preparations illustrate recording and stimulation sites within the dorsal cap of Kooy (DCK; A, gray), dorsal accessory olive (DAO; B, gray) and dorsal principal olive (DPO; C, gray) of the IO. D-F, Images of neurons within the DCK (D), DAO (E) and DPO (F). G-H, Representative averaged picrotoxin-sensitive inhibitory synaptic currents (IPSCs) recorded from DCK (G), DAO (H) and DPO (I) neurons evoked by 1 (top, left), 20 (middle) or 50 (bottom) Hz trains of 20 stimuli. Average currents for 1 Hz stimulation are shown (G-I, top, right). J-L, Summary plots of the peak (closed circles) and baseline (open circles) currents for each stimulus for cells collected as in G-I (n = 5 cells per region). Data are normalized to the average peak of the currents during 1 Hz stimulation for each region. Data are means ± SEM.
Figure 2
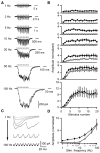
Figure 2. GABA release onto DPO neurons is unusually frequency-dependent and this characteristic is not developmentally restricted
A-D, IPSCs evoked by 1, 2, 5, 10, 20, 50 or 100 Hz trains of 20 stimuli were recorded from DPO neurons in slices from P23-25 rats. T-type calcium and Ih currents were pharmacologically blocked to prevent subthreshold membrane potential oscillations from obscuring IPSCs. A, Representative averaged traces of currents recorded from a DPO cell are shown. Tick marks indicate stimulation times. B, Summary plots of the peak (closed circles) and baseline (open circles) currents for each stimulus normalized to the average peak for 1 Hz stimulation (n = 5 cells) are shown. C, Representative traces of the average evoked IPSC following each of the last ten stimuli from the cell in A are shown. D, A summary plot of the average peak (closed circles) and average baseline (open circles) of the last ten stimuli in the train at each frequency for cells in B. Data are means ± SEM.
Figure 3
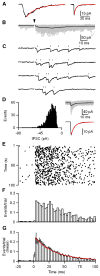
Figure 3. GABA release onto DPO neurons is asynchronous
A, Averaged traces from a representative cell in which IPSCs were evoked with 1 Hz stimulation (left) and spontaneous IPSCs (sIPSC; right) were recorded prior to each stimulation trial. 1 Hz stimulation resulted in an IPSC with a τ decay of 38 ms (red; left). The average sIPSC had a τ decay of 6 ms (red; right). B-G, IPSCs were evoked with trains of 180 stimuli at 1 Hz. Stimulus intensity was adjusted to allow identification of unitary events which is possible because events are not time-locked to stimulation. B, Raw traces from a representative cell are shown (gray) with their average (black). Arrowhead indicates stimulation time. C, Consecutive individual trials from B are shown. Tick marks indicate the event times as determined by our analysis routine. D, A histogram (left) of the event amplitudes from B is shown. Raw traces of non-overlapping events from B are shown (gray; D, right, top) with their average (black). The average event is shown (black; D, right, bottom) with an exponential fit to the decay (red; τ decay = 6 ms). E, A raster of the event times for the data in B. F, A histogram of the events per trial for the data in B (bin width = 2.5 ms). G, A summary histogram of experiments (n = 10 cells) as performed in B-F with an exponential fit to the decay (red; τdecay = 32 ms). Data are means ± SEM.
Figure 4
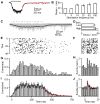
Figure 4. GABA release is further slowed during >5 Hz trains
A-B, IPSCs were evoked with trains of 20 stimuli at 1, 5, 10, 20, 50 and 100 Hz. A, Representative averaged trace of 50 Hz trials is provided with an exponential fit to the decay (red; τ decay = 53 ms). B, A bar plot of the decay τ for 1, 5, 10, 20, 50 and 100 Hz trains is shown (n = 5 cells). C-J, IPSCs were evoked with trains of 20 stimuli at 50 Hz. C, Raw traces from a representative cell are shown (gray) with their average (black). Stimulus intensity was adjusted to allow identification of unitary events. Tick marks indicate stimulation times. D, A bar plot of the decay τ for low- and high-intensity stimulation with 50 Hz trains. E, A raster of the event times for the data in C. F, A raster of event times for quanta released during the interstimulus interval for the last ten stimuli during each trial in E (bin widths = 1 ms). G, A histogram of the events per trial for the data in E (bin width = 10 ms). H, A histogram of the event times for F. I, A summary histogram of experiments (n = 6 cells) as performed in C with an exponential fit to the decay (red; τ decay = 65 ms). J, A summary histogram of event times during the interstimulus interval for the last ten stimuli during each trial as in H for the data in I. An exponential fit to the decay (red; τ decay = 2 ms) is provided. Data are means ± SEM.
Figure 5
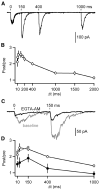
Figure 5. Slow IPSCs show prolonged residual calcium-dependent facilitation
A-B, Pairs of IPSCs were evoked (Δt = 10, 20, 40, 100, 150, 200, 400, 1000, 1500 and 2000 ms). A, Representative averaged traces of paired pulses given with a Δt of 150, 400 and 1000 ms are shown. Tick marks indicate stimulation times. B, A summary plot of paired-pulse ratios (PPR) is provided (n = 5-10 cells per point). C-D, Baseline responses were recorded with a Δt of 10 and 150 ms before application of EGTA-AM (100 μM) after which responses were recorded with a Δt of 10, 40, 150, 400 and 1000 ms. C, Representative averaged traces are shown before (gray) and after (black) EGTA-AM application. Tick marks indicate stimulation times. D, A summary plot of PPRs in control (black open circles; data from B), baseline prior to EGTA-AM (gray) and EGTA-AM (black closed circles; n = 5 cells) conditions. Data are means ± SEM.
Figure 6
Figure 6. Slow release of GABA results from presynaptic residual calcium signaling
A-D Unitary IPSCs were evoked in response to 1 Hz stimulus trains as in Figure 3. A, Histogram plots of mean event times per trial with exponential fits to the decay (red) are shown in control conditions from Δt = -3-0 minutes (left; τdecay = 35 ms), Δt = 1-4 minutes (middle; τdecay = 34 ms) and Δt = 5-8 minutes (right; τdecay = 35 ms). B-D, Recordings were preformed as in A with EGTA-AM (100 μM) application begun at Δt = 0 minutes. B, Raster plots of event times are shown for a representative example. C, Histogram plots of event times per trial for the data shown in B are provided. D, Histogram plots of mean event times per trial with exponential fits to the decay (red) are shown in baseline conditions from Δt = -3-0 minutes (left; τdecay = 31 ms), and at Δt = 1-4 minutes (middle; τdecay = 16 ms) and Δt = 5-8 minutes (right; τdecay = 6 ms) during EGTA-AM application begun at Δt = 0 minutes as in B-C. Histogram bin widths = 2.5 ms. Data are means ± SEM.

Similar articles

Cited by

References

    1. Alley K, Baker R, Simpson JI. Afferents to the vestibulo-cerebellum and the origin of the visual climbing fibers in the rabbit. Brain Res. 1975;98:582–589. - PubMed
    1. Atluri PP, Regehr WG. Delayed release of neurotransmitter from cerebellar granule cells. J Neurosci. 1998;18:8214–8227. - PMC - PubMed
    1. Bal T, McCormick DA. Synchronized oscillations in the inferior olive are controlled by the hyperpolarization-activated cation current I(h) J Neurophysiol. 1997;77:3145–3156. - PubMed
    1. Balaban CD, Beryozkin G. Organization of vestibular nucleus projections to the caudal dorsal cap of kooy in rabbits. Neuroscience. 1994;62:1217–1236. - PubMed
    1. Barrett EF, Stevens CF. The kinetics of transmitter release at the frog neuromuscular junction. J Physiol. 1972;227:691–708. - PMC - PubMed

Publication types

MeSH terms

LinkOut - more resources