

Changes in cortical grey matter density associated with long-standing retinal visual field defects
- PMID: 19467992
- PMCID: PMC2702836
- DOI: 10.1093/brain/awp119
Changes in cortical grey matter density associated with long-standing retinal visual field defects
Abstract
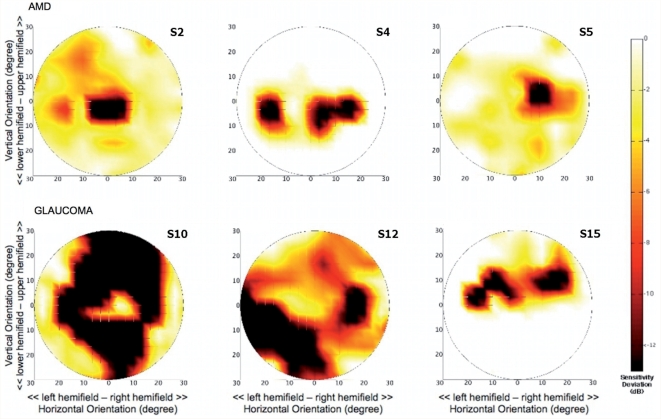
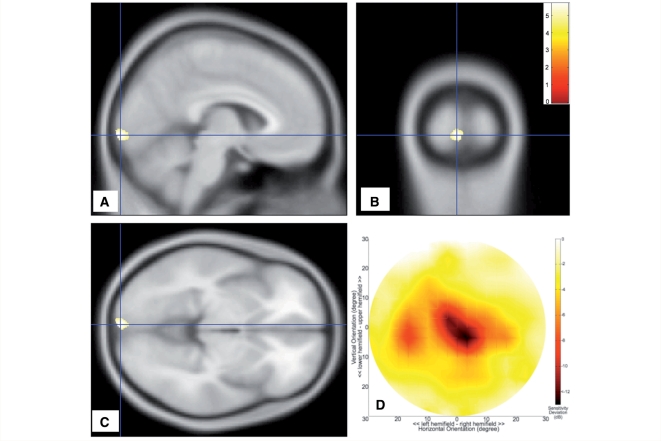
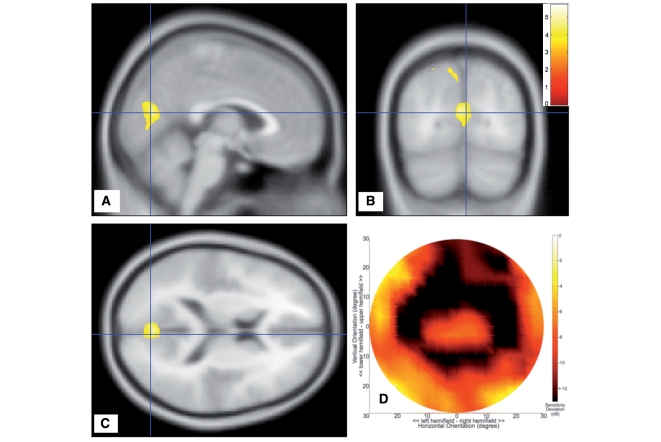
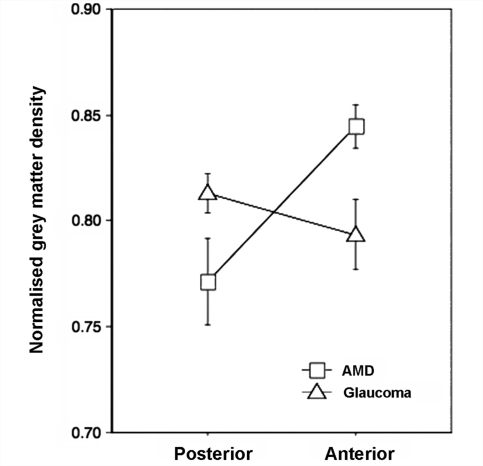
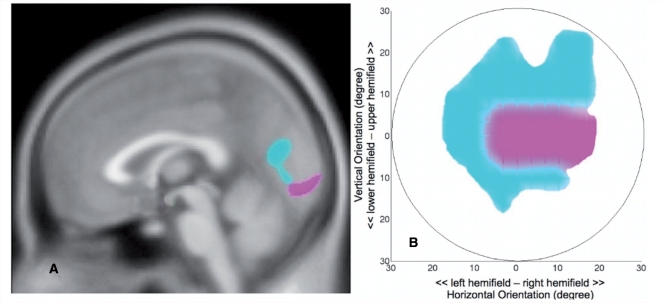
Retinal lesions caused by eye diseases such as glaucoma and age-related macular degeneration can, over time, eliminate stimulation of parts of the visual cortex. This could lead to degeneration of inactive cortical neuronal tissue, but this has not been established in humans. Here, we used magnetic resonance imaging to assess the effects of prolonged sensory deprivation in human visual cortex. High-resolution anatomical magnetic resonance images were obtained in subjects with foveal (age-related macular degeneration) and peripheral (glaucoma) retinal lesions as well as age-matched controls. Comparison of grey matter between patient and control groups revealed density reductions in the approximate retinal lesion projection zones in visual cortex. This indicates that long-term cortical deprivation, due to retinal lesions acquired later in life, is associated with retinotopic-specific neuronal degeneration of visual cortex. Such degeneration could interfere with therapeutic strategies such as the future application of artificial retinal implants to overcome lesion-induced visual impairment.
Figures
Similar articles
-
Plasticity Beyond V1: Reinforcement of Motion Perception upon Binocular Central Retinal Lesions in Adulthood.J Neurosci. 2017 Sep 13;37(37):8989-8999. doi: 10.1523/JNEUROSCI.1231-17.2017. Epub 2017 Aug 16. J Neurosci. 2017. PMID: 28821647 Free PMC article.
-
Preserved retinotopic brain connectivity in macular degeneration.Ophthalmic Physiol Opt. 2016 May;36(3):335-43. doi: 10.1111/opo.12279. Epub 2016 Feb 29. Ophthalmic Physiol Opt. 2016. PMID: 26923706
-
Structural brain MRI studies in eye diseases: are they clinically relevant? A review of current findings.Acta Ophthalmol. 2016 Mar;94(2):113-21. doi: 10.1111/aos.12825. Epub 2015 Sep 11. Acta Ophthalmol. 2016. PMID: 26361248 Review.
-
Surface-Based Analyses of Anatomical Properties of the Visual Cortex in Macular Degeneration.PLoS One. 2016 Jan 20;11(1):e0146684. doi: 10.1371/journal.pone.0146684. eCollection 2016. PLoS One. 2016. PMID: 26789126 Free PMC article. Clinical Trial.
-
Pattern of visual field defects in normal-tension and high-tension glaucoma.Curr Opin Ophthalmol. 1995 Apr;6(2):36-45. doi: 10.1097/00055735-199504000-00007. Curr Opin Ophthalmol. 1995. PMID: 10150856 Review.
Cited by
-
Secondary post-geniculate involvement in Leber's hereditary optic neuropathy.PLoS One. 2012;7(11):e50230. doi: 10.1371/journal.pone.0050230. Epub 2012 Nov 27. PLoS One. 2012. PMID: 23209682 Free PMC article.
-
White matter alterations in glaucoma and monocular blindness differ outside the visual system.Sci Rep. 2021 Mar 25;11(1):6866. doi: 10.1038/s41598-021-85602-x. Sci Rep. 2021. PMID: 33767217 Free PMC article.
-
Possible links between the lag structure in visual cortex and visual streams using fMRI.Sci Rep. 2019 Mar 12;9(1):4283. doi: 10.1038/s41598-019-40728-x. Sci Rep. 2019. PMID: 30862848 Free PMC article.
-
Mapping cortical thickness of the patients with unilateral end-stage open angle glaucoma on planar cerebral cortex maps.PLoS One. 2014 Apr 7;9(4):e93682. doi: 10.1371/journal.pone.0093682. eCollection 2014. PLoS One. 2014. PMID: 24709970 Free PMC article. Clinical Trial.
-
Changes in primary visual and auditory cortex of blind and sighted adults following 10 weeks of click-based echolocation training.Cereb Cortex. 2024 Jun 4;34(6):bhae239. doi: 10.1093/cercor/bhae239. Cereb Cortex. 2024. PMID: 38897817 Free PMC article.
References
-
- Acaroglu G, Tali T, Batman A, Sinik B, Oskan S. Comparative study of brain magnetic resonance imagings in normal tension glaucoma, primary open-angle glaucoma, and normal subjects. Neuro-Ophthalmology. 2001;26:103–7.
-
- Ashburner J, Friston KJ. Voxel-based morphometry – the methods. Neuroimage. 2000;11:805–21. - PubMed
-
- Ashburner J, Friston KJ. Unified segmentation. Neuroimage. 2005;26:839–51. - PubMed
-
- Boucard CC. Neuro-imaging of visual field defects. PhD thesis, University of Groningen; 2006.
Publication types
MeSH terms
LinkOut - more resources
Full Text Sources
Medical
