. 2009 Jul;110(1):328-42.
doi: 10.1111/j.1471-4159.2009.06142.x. Epub 2009 May 3.

Proteasome-caspase-cathepsin sequence leading to tau pathology induced by prostaglandin J2 in neuronal cells

Affiliations

Proteasome-caspase-cathepsin sequence leading to tau pathology induced by prostaglandin J2 in neuronal cells

Lisette T Arnaud et al. J Neurochem. 2009 Jul.

Abstract

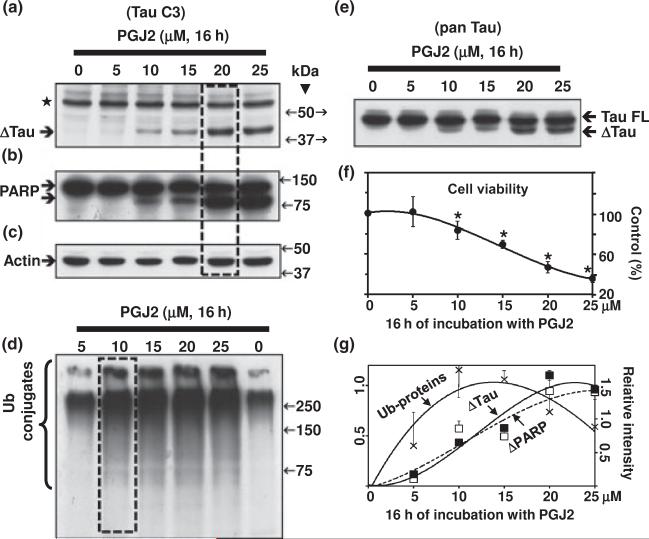
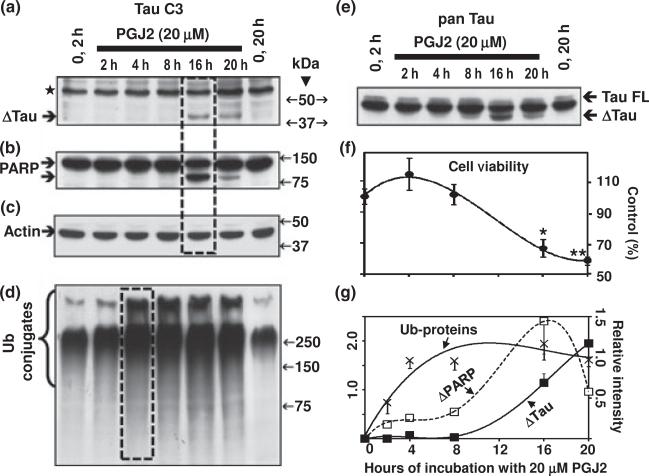
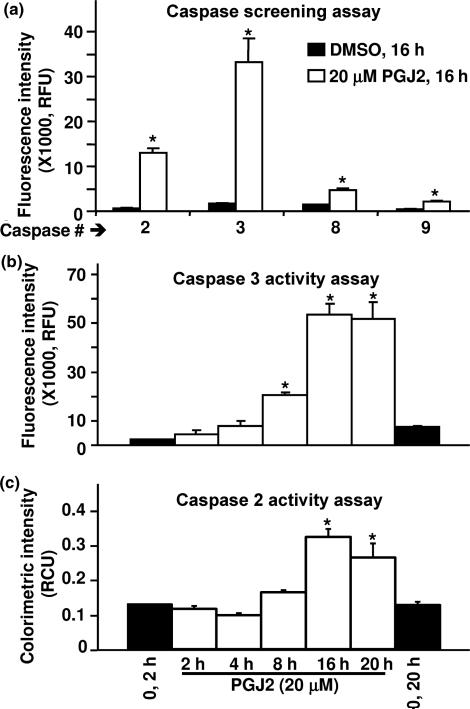
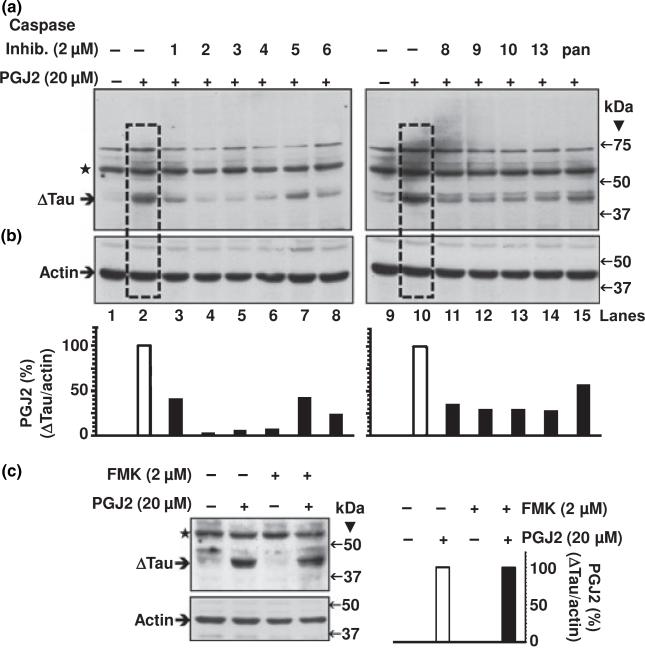
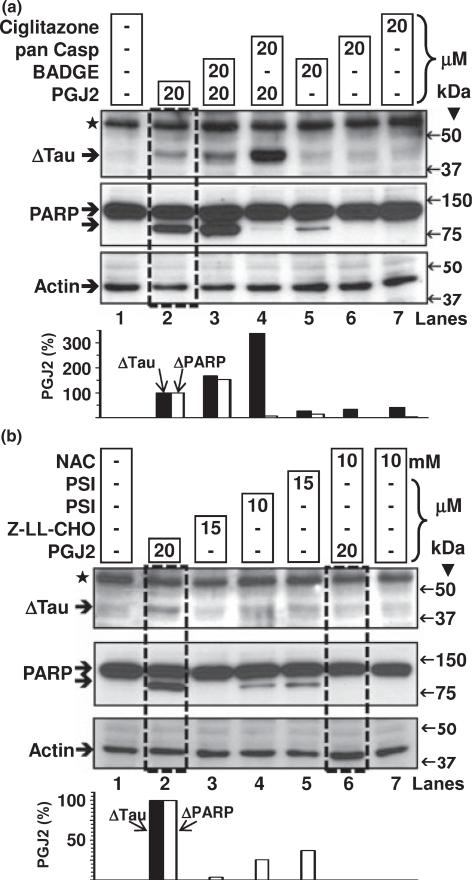
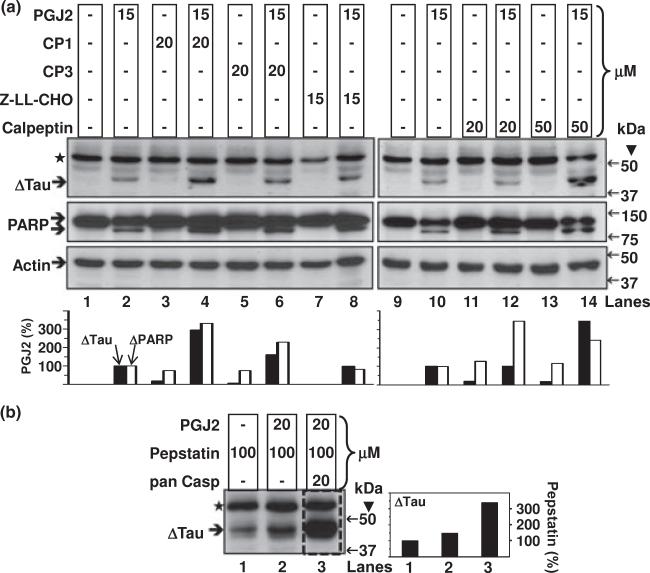
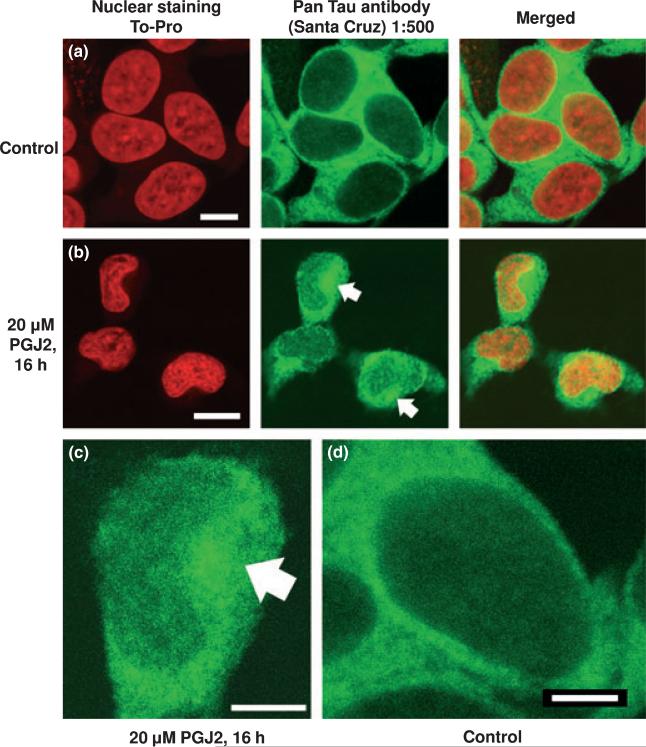
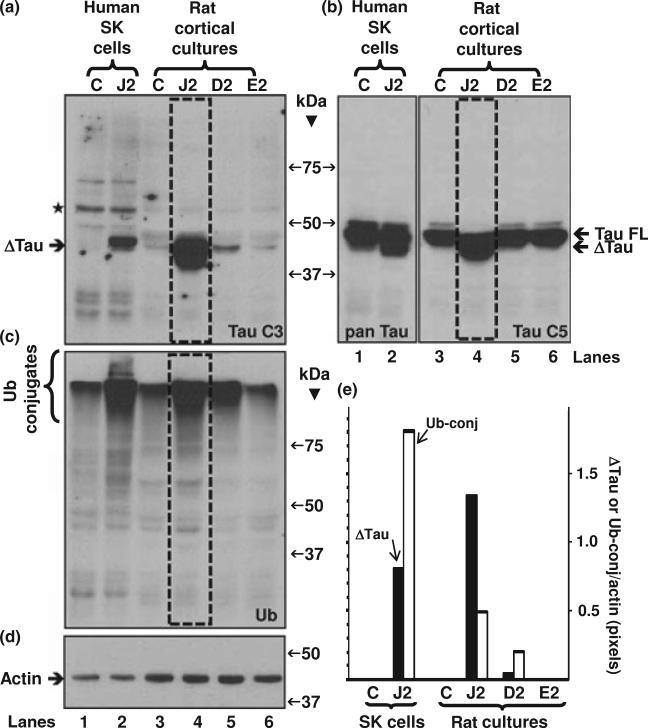
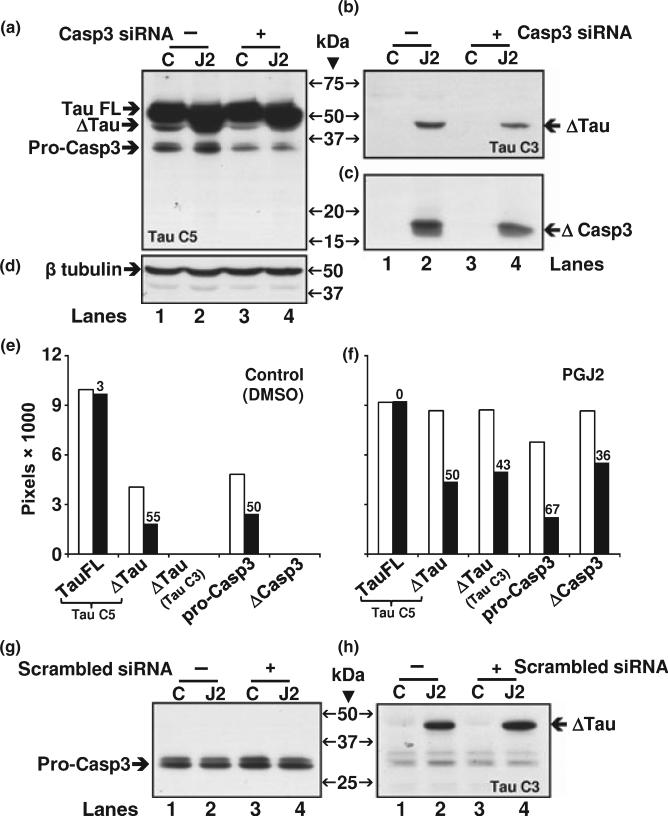
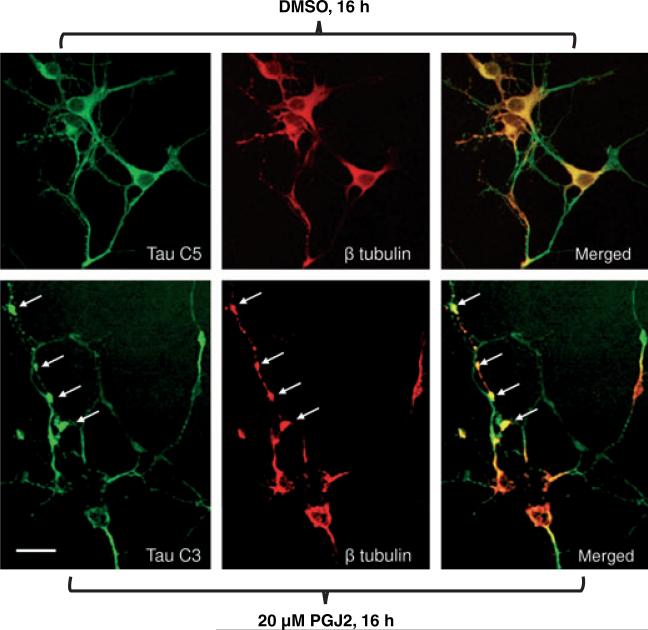
Neurofibrillary tangles (NFT) are a hallmark of Alzheimer's disease. The major neurofibrillary tangle component is tau that is truncated at Asp421 (Deltatau), hyperphosphorylated and aggregates into insoluble paired helical filaments. Alzheimer's disease brains also exhibit signs of inflammation manifested by activated astrocytes and microglia, which produce cytotoxic agents among them prostaglandins. We show that prostaglandin (PG) J2, an endogenous product of inflammation, induces caspase-mediated cleavage of tau, generating Deltatau, an aggregation prone form known to seed tau aggregation prior to neurofibrillary tangle formation. The initial event observed upon PGJ2-treatment of human neuroblastoma SK-N-SH cells was the build-up of ubiquitinated (Ub) proteins indicating an early disruption of the ubiquitin-proteasome pathway. Apoptosis kicked in later, manifested by caspase activation and caspase-mediated cleavage of tau at Asp421 and poly (ADP-ribose) polymerase. Furthermore, cathepsin inhibition stabilized Deltatau suggesting its lysosomal clearance. Upon PGJ2-treatment tau accumulated in a large perinuclear aggregate. In rat E18 cortical neuronal cultures PGJ2-treatment also generated Deltatau detected in dystrophic neurites. Levels of Deltatau were diminished by caspase 3 knockdown using siRNA. PGD2, the precursor of PGJ2, produced some Deltatau. PGE2 generated none. Our data suggest a potential sequence of events triggered by the neurotoxic product of inflammation PGJ2 leading to tau pathology. The accumulation of Ub proteins is an early response. If cells fail to overcome the toxic effects induced by PGJ2, including accumulation of Ub proteins, apoptosis kicks in triggering caspase activation and tau cleavage, the clearance of which by cathepsins could be compromised culminating in tau pathology. Our studies are the first to provide a mechanistic link between inflammation and tau pathology.


Figures

Fig. 1
Fig. 1
PGJ2-treatment induces accumulation of ubiquitinated proteins, tau cleavage and apoptosis in a dose-dependent manner. (a) and (e) Western blot analyses (10% gels) to detect tau in total extracts of human SK-N-SH neuroblastoma cells (30 lg of protein/lane) treated with PGJ2 for 16 h. In (a) the blot was probed with the TauC3 antibody (tau cleaved at Asp421, epitope a.a. 412–421). In (e) the blot was probed with the pan tau (clone 13, epitope a.a. 2–18) antibody which reacts with all tau isoforms. Equal protein loading was demonstrated by probing the immunoblots with the anti-actin antibody (c). (b) Blots were stripped and reprobed with the anti-PARP antibody, which detects cleaved PARP, an apoptosis marker. (d) Blots were stripped and reprobed again with the anti-ubiquitinated (Ub) proteins antibody. (f) Cell viability was assessed with the MTT assay. Data represent the mean ± SEM from at least three determinations. The viability for each condition was compared to the viability of cells treated with vehicle only (control, 100%). The asterisk (*) identifies the values that are significantly different (p < 0.001) from the control. (g) The levels of Ub-proteins (crosses), Δtau (solid squares) and cleaved PARP (open squares) were semi-quantified by densitometry. Data represent the relative intensity for Δtau and cleaved PARP (right scale) or Ub-proteins (left scale) for each PGJ2-concentration. The values obtained under control (no PGJ2) conditions were subtracted from each sample. Values represent means and SD from duplicate experiments. Molecular mass markers in kDa are shown in the middle. Boxes highlight the peaks in Δtau levels (a) and Ub-proteins (d). ΔTAU, tau cleaved at Asp421; TAU FL, full length TAU; ⋆, unspecific band.
Fig. 2
Fig. 2
PGJ2-treatment induces accumulation of ubiquitinated proteins, tau cleavage and apoptosis in a time-dependent manner. (a) and (e) Western blot analyses (10% gels) to detect tau in total extracts of human SK-N-SH neuroblastoma cells (30 μg of protein/lane) treated with 20 μM PGJ2 for different times (2 h, 4 h, 8 h, 16 h, and 20 h). In (a) the blot was probed with the TauC3 antibody (tau cleaved at Asp421, epitope a.a. 412–421). In (e) the blot was probed with the pan tau (clone 13, epitope a.a. 2–18) antibody which reacts with all tau isoforms. Equal protein loading was demonstrated by probing the immunoblots with the anti-actin antibody (c). (b) Blots were stripped and reprobed with the anti-PARP antibody, which detects cleaved PARP, an apoptosis marker. (d) Blots were stripped and reprobed again with the anti-ubiquitinated (Ub) proteins antibody. (f) Cell viability was assessed with the MTT assay. Data represent the mean ± SEM from at least three determinations. The viability of cells treated with 20 μM PGJ2 for each time point was compared to the viability of cells treated with vehicle only for 20 h (control, 100%). The asterisks identify the values that are significantly different (*p < 0.05; **p < 0.01) from the control. (g) The levels of Ub-proteins (crosses), Δtau (solid squares) and cleaved PARP (open squares) were semi-quantified by densitometry. Data represent the relative intensity for Δtau and cleaved PARP (left scale) or ub-proteins (right scale) for each time point. The values obtained under control (no PGJ2) conditions were subtracted from each sample. Values represent means and SD from duplicate experiments. Molecular mass markers in kDa are shown on the middle. Boxes highlight the peaks in Δtau (a), cleaved PARP (b) and Ub-protein (d) levels. TAU, tau cleaved at Asp421; TAU FL, full length TAU; ⋆, unspecific band.
Fig. 3
Fig. 3
PGJ2-treatment increases caspase activity. (a) The activities of caspases 2, 3, 8 and 9 were determined in SK-N-SH cells treated with DMSO (vehicle, black bars) or treated with 20 μM PGJ2 (white bars) for 16 h. Relative caspase activities (RFU = relative fluorescent units) normalized for protein (200 lg/assay) are shown. Results from two determinations are presented (mean ± SD). The asterisk (*) identifies the values that are significantly different (p ≤ 0.014, t-test) from the controls. (b) Caspase 3 and (c) Caspase 2 activities were determined in SK-N-SH cells treated with DMSO (vehicle, 2 h and 20 h, black bars) or treated with 20 μM PGJ2 (white bars) for 2 h, 4 h, 8 h, 16 h, and 20 h. Relative caspase activities (RFU or RCU = relative fluorescent or colorimetric units, respectively) normalized for protein (200 μg/assay) are shown. Results from at least two determinations are presented [mean ± SEM (b) and SD (c)]. The asterisk (*) identifies the values that are significantly different (at least p < 0.01, anova, Tukey-Kramer multiple comparison test) from the control.
Fig. 4
Fig. 4
Individual caspase inhibitors (2 μM) attenuate the PGJ2-dependent increase in Δtau levels. ΔTau levels in total extracts of human SK-N-SH neuroblastoma cells (50 μg of protein/lane) were assessed by western blot analysis with the Tau C3 antibody (tau cleaved at Asp421, epitope a.a. 412–421). Cells were treated for 16 h with DMSO (vehicle, control, lanes 1 and 9) or with 20 μM PGJ2 alone (lanes 2 and 10, boxed) or with 20 μM PGJ2 after a 40-min pre-incubation with 2 μM of individual caspase inhibitors (1 through 6, lanes 3–8; 8 through 10, lanes 11–13, and 13, lane 14) or the pan caspase inhibitor (Z-VAD-FMK, lane 15). (c) As an FMK negative control, cells were separately incubated with Z-FA-FMK in the absence and presence of PGJ2. The levels of Δtau and actin in (a) through (c) were semi-quantified by densitometry. The data represent the ratio of Δtau/actin for all conditions compared to the PGJ2-treatment by itself (white bars), which was considered to be 100%. Values are from a representative experiment. Similar results were obtained in duplicate experiments. Molecular mass markers in kDa are shown on the right. ΔTau, tau cleaved at Asp421; ⋆, unspecific band.
Fig. 5
Fig. 5
Pharmacological manipulation of Δtau with PPARγ agonist/antagonist, proteasome or calpain inhibitors and the anti-oxidant NAC. ΔTau levels in total extracts of human SK-N-SH neuroblastoma cells (30 μg of protein/lane) were assessed by western blot analysis with the Tau C3 antibody (tau cleaved at Asp421, epitope a.a. 412–421). Cells were treated for 16 h with DMSO (vehicle, control, lanes 1a and 1b) or with 20 μM PGJ2 alone (lanes 2a and 2b, boxed) or with 20 μM PGJ2 after a 40-min pre-incubation with BADGE (lane 3a, PPARγ antagonist), pan caspase inhibitor (Z-VAD-FMK, lane 4a), or NAC (lane 6b, boxed, anti-oxidant). Cells were also separately incubated with BADGE (lane 5a), pan caspase inhibitor (lane 6a), ciglitazone (PPARγ agonist, lane 7a), proteasome inhibitor (lanes 4b and 5b), calpain inhibitor (lane 3b), or NAC (lane 7b). The levels of Δtau, cleaved PARP and actin were semi-quantified by densitometry. The data represent the ratio of Δtau/actin (black bars) and ΔPARP/actin (white bars) for all conditions compared to the PGJ2-treatment by itself, which was considered to be 100%. Similar results were obtained in duplicate experiments. Molecular mass markers in kDa are shown on the right. ΔTau, tau cleaved at Asp421; ⋆, unspecific band.
Fig. 6
Fig. 6
Calpain inhibitors fail to attenuate the PGJ2-dependent increase in Δtau levels while cathepsin inhibition stabilizes Δtau. ΔTau levels in total extracts of human SK-N-SH neuroblastoma cells (40 μg of protein/lane) were assessed by western blot analysis with the Tau C3 antibody (tau cleaved at Asp421, epitope a.a. 412–421). Cells were treated for 16 h with DMSO (vehicle, control, lanes 1a and 9a) or with 15 μM PGJ2 alone (lanes 2 a and 10a) or with 15 μM PGJ2 after a 40-min pre-incubation with calpain inhibitors (CP1, lane 4a, CP3, lane 6a, Z-LL-CHO, lane 8a, and calpeptin, lanes 12a and 14a). Cells were also treated for 16 h with 20 μM PGJ2 after a 40-min pre-incubation with a cathepsin inhibitor alone (pepstatin, lane 2b) or in combination with the pan caspase inhibitor (pan casp, lane 3b). Cells were also separately incubated with the calpain inhibitors or pepstatin (lanes 3a, 5a, 7a, 11a, 13a and 1b). The levels of Δtau, cleaved PARP and actin were semi-quantified by densitometry. In (a), the data represent the ratio of Δtau/actin (black bars) and ΔPARP/actin (white bars) for all conditions compared to the PGJ2-treatment by itself, which were considered to be 100%. In (b), the data represent the ratio of Δtau/⋆ for all conditions compared to the pepstatin-treatment by itself, which we considered to be 100%. Similar results were obtained in duplicate experiments. Molecular mass markers in kDa are shown on the right. ΔTAU, tau cleaved at Asp421; ⋆, unspecific band.
Fig. 7
Fig. 7
PGJ2-treatment triggers the formation of tau aggregates. Immunofluorescence staining of SK-N-SH cells treated with vehicle only (DMSO, a and d)or 20 μM PGJ2 (b and c) for 16 h. Tau (green) was visualized by immunostaining with the pan tau antibody (Santa Cruz). Nuclei (red) were detected with TO-PRO-3. Merged images are shown for tau/To-Pro. Arrows point to large tau aggregates. The scale bar is 7.3 μm (a), 11.9 μm (b), 5.5 μm (c) and 3.6 μm (d). Similar results were obtained in duplicate experiments.
Fig. 8
Fig. 8
PGJ2-treatment and to a lesser extent PGD2, induce tau cleavage at Asp421 and accumulation of ubiquitinated proteins in rat (E18) primary cortical neuronal cultures, but PGE2 does not. Western blot analyses (45 μg of protein/lane) to detect tau in total extracts of rat primary cortical cultures treated with DMSO (vehicle, control, C), 20 μM PGJ2 (J2), 20 μM PGD2 (D2) or 80 μM PGE2 (E2) and in SK-N-SH cells (positive control) treated with DMSO (vehicle, control, C) or 20 μM PGJ2 (J2) for 16 h. The blot was probed with the TauC3 antibody (a) then stripped and reprobed with the pan tau clone 5 antibody for the rat cultures or the pan tau clone 13 antibody for the SK-N-SH cells (b). The blot was stripped and reprobed again with the anti-ubiquitinated (Ub) proteins antibody (c). Equal protein loading (6 μg of protein/lane) was demonstrated by probing parallel immunoblots with the anti-actin antibody (d). The levels of Δtau, ubiquitinated proteins (Ub-conj) and actin were semi-quantified by densitometry (e). The data represent the pixel ratio of Δtau/actin (black bars) and Ub-conj/ actin (white bars) for all conditions. The values obtained under control (no PGJ2) conditions were subtracted from each sample. Similar results were obtained in duplicate experiments. Molecular mass markers in kDa are shown in the middle. ΔTau, tau cleaved at Asp421; TAU FL, full length tau; ⋆, unspecific band.
Fig. 9
Fig. 9
Caspase 3 knockdown by siRNA decreases the levels of PGJ2-induced tau cleavage at Asp421 in rat (E18) primary cortical neuronal cultures. Neuronal cultures were treated with Caspase 3 (Casp3) siRNA at 80 nM and total lysates were analyzed by western blotting (18 μg of protein/lane) to detect in (a) full length (FL) and cleaved (Δ) tau as well as pro-caspase 3, in (b) Δtau, in (c) cleaved (Δ) caspase 3 and in (d) β tubulin, as loading control. Following siRNA incubations (6 h) the cortical cultures were treated with DMSO (vehicle, control, C) or 20 μM PGJ2 (J2) for 16 h. The same blot was probed sequentially with the TauC3, caspase 3, pan TauC5 and β tubulin antibodies. The levels of tauFL, Δtau, pro-caspase3 (pro-Casp3) and cleaved caspase3 (ΔCasp3) were semi-quantified by densitometry (e and f). The graphs correspond to control (e) and PGJ2-treated (f) cultures. Within each graph, the white bars represent untreated cultures (no Casp3 siRNA) and black bars represent cultures treated with Casp3 siRNA. The numbers above the black bars correspond to the percent decrease in expression because of the Casp3 siRNA treatment. As a control, cells were treated with a scrambled siRNA instead of the Casp 3 siRNA and probed for Δtau (h) and procaspase 3 (g). Molecular mass markers in kDa are shown in the middle. ΔTAU, tau cleaved at Asp421; TAU FL, full length tau.
Fig. 10
Fig. 10
PGJ2 induces neurite dystrophy in rat (E18) primary cortical neuronal cultures. TAU (green) and β tubulin (red) immunofluorescent staining of rat cortical neurons treated with DMSO (top panels)or 20 μM PGJ2 (bottom panels) for 16 h. ΔTau was detected in the PGJ2-treated cells with the TauC3 antibody (lower panel). In control cells (upper panels) tau was detected with the TauC5 antibody as no immunofluorescence was detected with the TauC3 antibody, which is specific for Δtau. The arrows are pointing to dystrophic neuritis. Scale bar = 15 μm. Similar results were obtained in duplicate experiments.

Similar articles

Cited by

References

    1. Alves-Rodrigues A, Gregori L, Figueiredo-Pereira ME. Ubiquitin, cellular inclusions and their role in neurodegeneration. Trends Neurosci. 1998;21:516–520. - PubMed
    1. Aoun P, Simpkins JW, Agarwal N. Role of PPAR-gamma ligands in neuroprotection against glutamate-induced cytotoxicity in retinal ganglion cells. Invest. Ophthalmol. Vis. Sci. 2003;44:2999–3004. - PubMed
    1. Biedler JL, Roffler-Tarlov S, Schachner M, Freedman LS. Multiple neurotransmitter synthesis by human neuroblastoma cell lines and clones. Cancer Res. 1978;38:3751–3757. - PubMed
    1. Cho JH, Johnson GV. Glycogen synthase kinase 3 beta induces caspase-cleaved tau aggregation in situ. J. Biol. Chem. 2004;279:54716–54723. - PubMed
    1. Davidson TJ, Harel S, Arboleda VA, Prunell GF, Shelanski ML, Greene LA, Troy CM. Highly efficient small interfering RNA delivery to primary mammalian neurons induces MicroRNA-like effects before mRNA degradation. J. Neurosci. 2004;24:10040–10046. - PMC - PubMed

Publication types

MeSH terms