. 2009 May 19;2(71):ra23.
doi: 10.1126/scisignal.2000278.

TRPM2 functions as a lysosomal Ca2+-release channel in beta cells

Affiliations

TRPM2 functions as a lysosomal Ca2+-release channel in beta cells

Ingo Lange et al. Sci Signal. .

Abstract

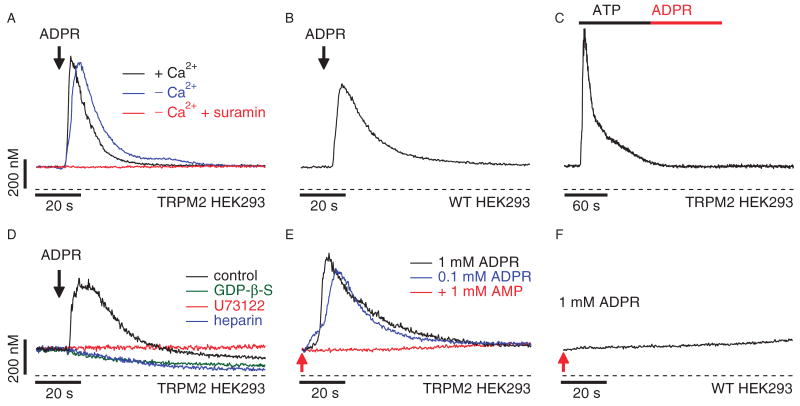
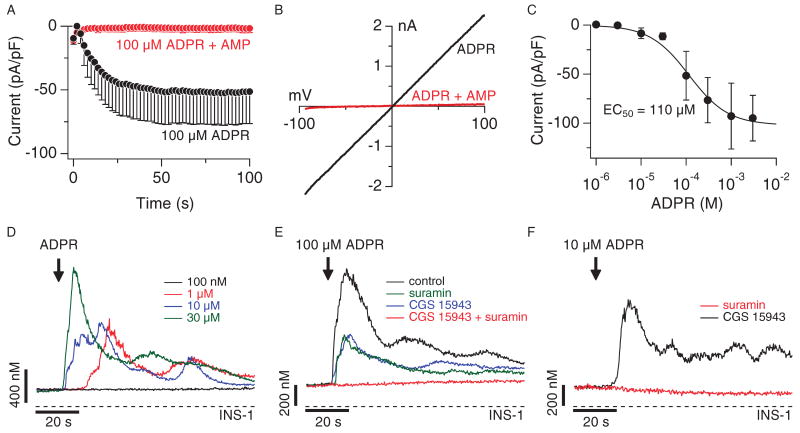
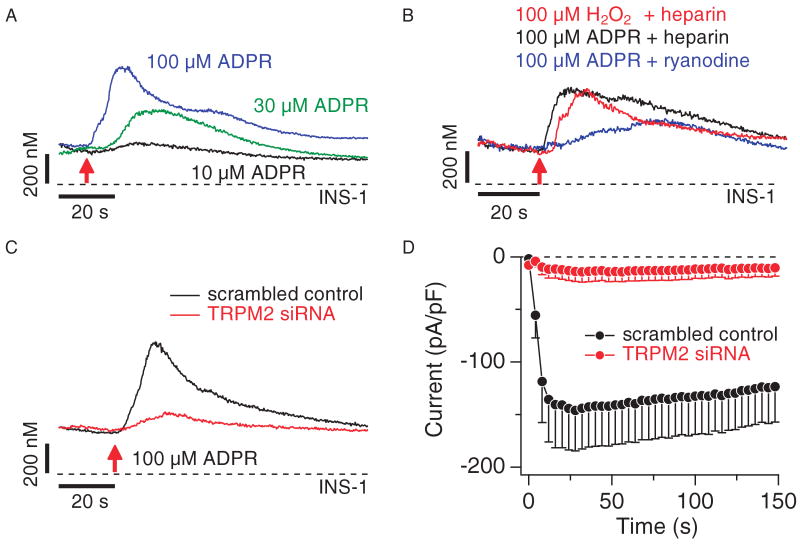
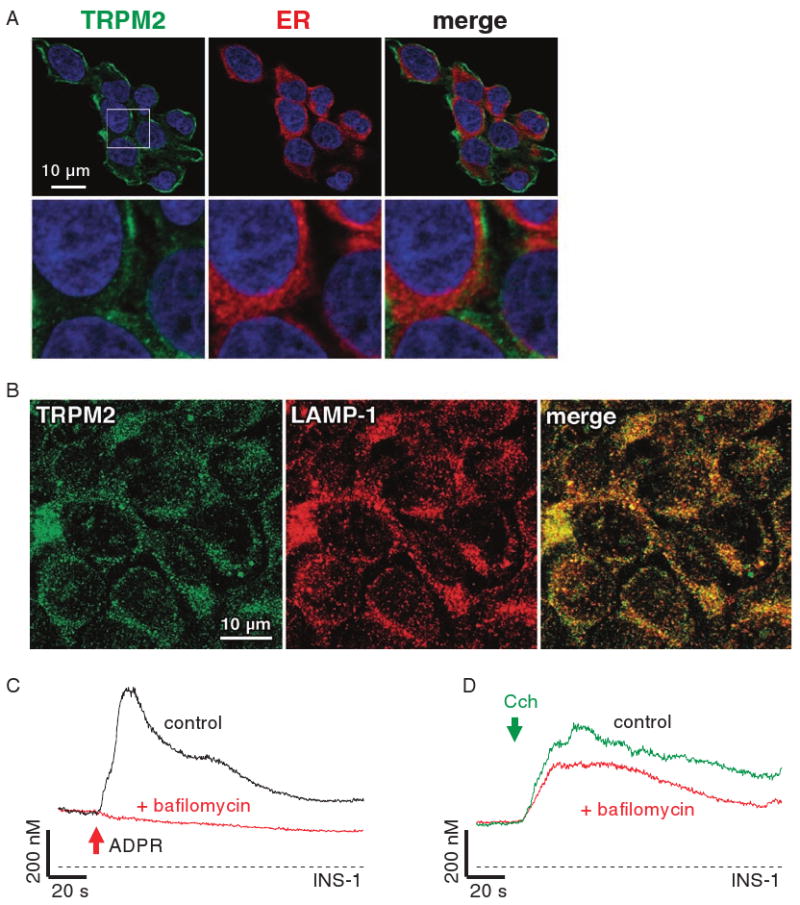
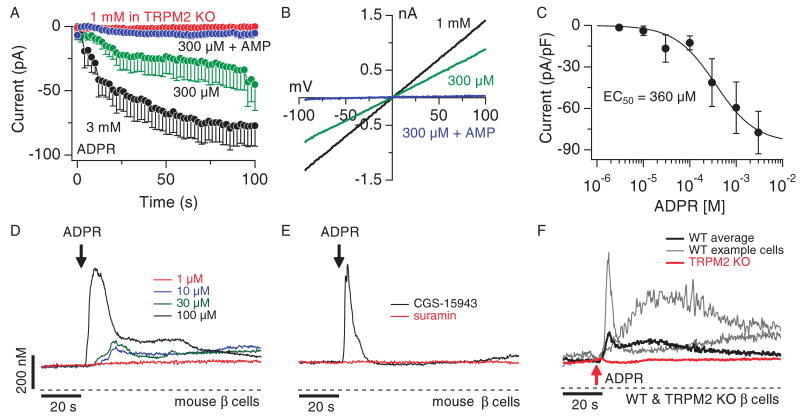
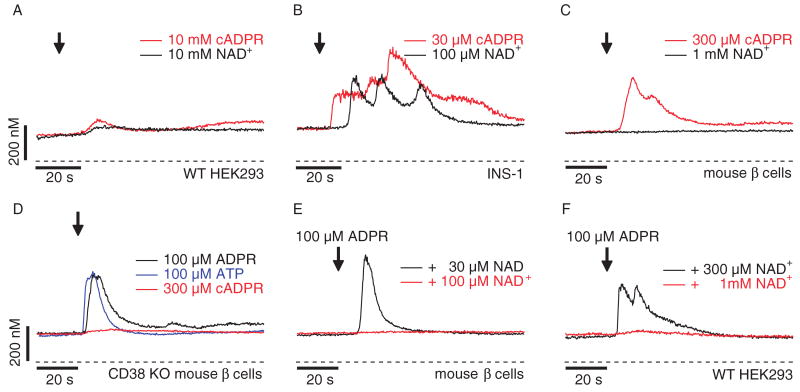
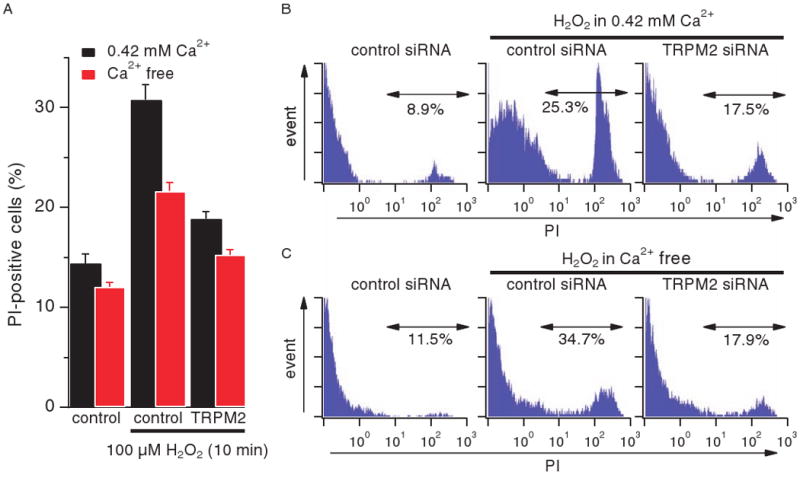
TRPM2 is a Ca2+-permeable cation channel that is specifically activated by adenosine diphosphoribose (ADPR). Channel activation in the plasma membrane leads to Ca2+ influx and has been linked to apoptotic mechanisms. The primary agonist, ADPR, is produced both extra- and intracellularly and causes increases in intracellular calcium concentration ([Ca2+]i), but the mechanisms involved are not understood. Using short interfering RNA and a knockout mouse, we report that TRPM2, in addition to its role as a plasma membrane channel, also functions as a Ca2+-release channel activated by intracellular ADPR in a lysosomal compartment. We show that both functions of TRPM2 are critically linked to hydrogen peroxide-induced beta cell death. Additionally, extracellular ADPR production by the ectoenzyme CD38 from its substrates NAD+ (nicotinamide adenine dinucleotide) or cADPR causes IP3-dependent Ca2+ release via P2Y and adenosine receptors. Thus, ADPR and TRPM2 represent multimodal signaling elements regulating Ca2+ mobilization in beta cells through membrane depolarization, Ca2+ influx, and release of Ca2+ from intracellular stores.


Conflict of interest statement

The authors declare no conflict of interest.

Figures

Fig. 1
Fig. 1
ADPR acts as a purinergic receptor agonist and TRPM2 acts as a Ca2+-release channel when heterologously expressed in HEK293 cells. (A) Average Ca2+ signals measured in intact HEK293 cells heterologously expressingTRPM2 channels (TRPM2 HEK293) in response to application of extracellular ADPR in the presence (1 mM, black trace, n = 8) or absence (blue trace, n = 7) of extracellular Ca2+ in the external solution. The concentration of ADPR was 1 mM in the presence of Ca2+ and 100 μM in the absence of Ca2+. The red trace represents the average Ca2+ signal measured in response to application of 100 μM ADPR in the absence of extracellular Ca2+ with 100 μM suramin (n = 6). Application started as indicated by the arrow and was maintained throughout the experiment. Cells were loaded with 5 μM fura-2-AM at 37°C for 30 min. (B) Average Ca2+ signals in intact wild-type HEK293 cells in response to application of 1 mM ADPR (black trace, n = 7) in the absence of extracellular Ca2+. Application and fura-2-AM loading as described in (A). (C) Average Ca2+ signal measured in intact fura-2-AM–loaded TRPM2 HEK293 cells in response to application of 100 μM ATP (black bar) followed by application of 100 μM ADPR (red bar) in the absence of extracellular Ca2+ (n = 6). (D) The traces depict balanced fura-2 experiments, in which TRPM2 HEK293 cells were preloaded with fura-2-AM and the patch pipette contained 200 μM fura-2 to enable continuous measurements of [Ca2+]i. Whole-cell break-in was just before application of 100 μM ADPR in the absence of extracellular Ca2+ as indicated by the arrow (black trace, n = 4). The internal solution was supplemented with either heparin (100 μg/ml; blue trace, n = 6) or 500 μM GDP-b-S (green trace, n = 5). The red trace represents Ca2+ measurements in intact cells exposed to 10 μM U73122 in the bath (n = 5). (E) Balanced fura-2 experiments with internal perfusion of ADPR. Average Ca2+ signal in whole-cell patch-clamped TRPM2 HEK293 cells preloaded with fura-2-AM. Whole-cell break-in was at the time indicated by the red arrow. Cells were kept in 0 Ca2+ external solution and perfused with internal solution containing 200 μM fura-2 and supplemented with either 1 mM ADPR (black trace, n = 6), 100 μM ADPR (blue trace, n = 7), or 100 μM ADPR and 1 mM AMP (red trace, n = 8). (F) Balanced fura-2 experiments in wild-type HEK293 cells preloaded with fura-2-AM. Whole-cell break-in was achieved at the time indicated by the red arrow. Internal solution contained 200 μM fura-2 supplemented with 1 mM ADPR (n = 6).
Fig. 2
Fig. 2
ADPR activates TRPM2, purinergic receptors, and adenosine receptors in INS-1 β cells. (A) Average development of TRPM2 currents assessed by whole-cell patch-clamp measurements in INS-1 cells. Cells were internally perfused with either 100 μM ADPR (black symbols, n = 11) or 100 μM ADPR + 1 mM AMP (red symbols, n = 9). Current amplitudes were assessed at −80 mV, normalized for cell size, averaged and plotted versus time of the experiment. The standard voltage protocol was ramping from −100 mV to +100 mV over 50 ms and at 0.5 Hz. Holding potential was 0 mV. Error bars indicate SEM. (B) Typical current-voltage (I-V) relationship of currents evoked by 1 mM ADPR (black trace), or 100 μM ADPR + 1 mM AMP (red trace) taken from example cells and recorded 100 s into the experiment. (C) Dose-response behavior of TRPM2 currents in INS-1 cells at various internal ADPR concentrations. Current amplitudes were measured at −80 mV, averaged, normalized to cell size, and plotted against the respective ADPR concentration (n = 5 to 11). A dose-response fit to the data yielded an EC50 value of 110 μM with a Hill coefficient of 1. (D) Average Ca2+ signals measured in intact fura-2-AM–loaded INS-1 cells in response to increasing concentrations of extracellular ADPR applied in the absence of extracellular Ca2+ [100 nM (black trace, n = 6), 1 μM (red trace, n = 6), 10 μM (blue trace, n = 6), 30 μM (green trace, n = 6)]. (E) Average Ca2+ signals measured in intact fura-2-AM–loaded INS-1 cells in the absence of extracellular Ca2+ and stimulated by 30 μM extracellular ADPR (black trace, control, n = 11) or 100 μM ADPR plus either 100 μM suramin (green trace, n = 8) or 1 μM CGS-15943 (blue trace, n = 11) or both 100 μM suramin and 1 μM CGS-15943 (red trace, n = 6). (F) Average Ca2+ signals measured in intact fura-2-AM–loaded INS-1 cells in the absence of extracellular Ca2+ and stimulated by 10 μM ADPR plus either 100 μM suramin (black trace, n = 6) or 1 μM CGS-15943 (red trace, n = 6).
Fig. 3
Fig. 3
TRPM2 functions as Ca2+-release channel in INS-1 cells. (A) Balanced fura-2 experiments showing average Ca2+ signals in whole-cell patch-clamped INS-1 cells preloaded with fura-2-AM. Whole-cell break-in was at the time indicated by the red arrow. Cells were kept in 0 Ca2+ external solution supplemented with 1 μM CGS-15943 and 100 μM suramin and perfused with internal solution containing 200 μM fura-2 and supplemented with either 100 μM ADPR (blue trace, n = 9), 30 μM ADPR (green trace, n = 8), or 10 μM ADPR (black trace, n = 6). (B) Balanced fura-2 experiments, showing average Ca2+ signals in whole-cell patch-clamped INS-1 cells preloaded with fura-2-AM. Whole-cell break-in was at the time indicated by the red arrow. Cells were kept in 0 Ca2+ external solution containing 1 μM CGS-15943 and 100 μM suramin. Cells were perfused with internal solution containing 200 μM fura-2 and supplemented with either 100 μM H2O2 plus heparin (100 μg/ml; red trace, n = 10), 100 μM ADPR plus heparin (100 μg/ml; black trace, n = 7), or 100 μM ADPR with 25 μM external ryanodine (blue trace, n= 6). (C) Balanced fura-2 experiments showing average Ca2+ signals in response to internal ADPR in whole-cell patch-clamped INS-1 cells preloaded with fura-2-AM. Whole-cell break-in was at the time indicated by the red arrow. Cells were kept in 0 Ca2+ external solution supplemented with 100 μM suramin and 1 μM CGS-15943 and perfused with internal solution containing 200 μM fura-2 and supplemented with 100 μM ADPR. Traces represent Ca2+ signals from cells treated with scrambled control siRNA (black trace, n = 10) or TRPM2-specific siRNA (red trace, n = 10). (D) Average TRPM2 currents assessed by whole-cell patch-clamp measurements in INS-1 cells treated with scrambled control siRNA (black symbols, n = 8) or TRPM2-specific siRNA (red symbols, n = 14). Currents were analyzed as described in Fig. 2A.
Fig. 4
Fig. 4
TRPM2 is a lysosomal Ca2+-release channel in INS-1 cells. (A) Detection and cellular localization of TRPM2 by immunofluorescence. Polyclonal antibodies directed against mouse TRPM2 specifically recognizes a protein in INS-1 cells with cytosolic, as well as plasma membrane distribution (left panels, green). Intracellular TRPM2 label is largely excluded from the ER (middle panels, red) network, as evidenced by the merged image (right panels, note absence of yellow spots). DAPI (4′,6-diamidino-2-phenylindole) was used as a nuclear counterstain (blue). Images of cells that are representative of the entire population are shown (63× magnification). The white rectangle indicates the area of expanded view depicted in the respective lower panels. Note the punctuated appearance of intracellularly located TRPM2, indicating vesicular localization. (B) Immunofluorescence of TRPM2 (left panel, green) and LAMP-1 (middle panel, red) with antibodies directed against TRPM2 (3) and LAMP-1. The right panel represents the merged image, suggesting that both proteins have largely overlapping localizations (yellow), with just a few vesicles showing only TRPM2 fluorescence. Cells were visualized with a confocal laser scanning microscope with 63× objective and images are representative of the entire population. (C) Bafilomycin A inhibits intracellular ADPR-mediated Ca2+ release. Balanced fura-2 experiments showing average Ca2+ signals in whole-cell patch-clamped INS-1 cells preloaded with fura-2-AM. Whole-cell break-in was at the time indicated by the red arrow. Cells were kept in 0 Ca2+ external solution containing 100 μM suramin and 1 μM CGS-15943 in the absence (control, black trace, n = 9) or presence of 100 nM bafilomycin A (red trace, n = 16) and perfused with internal solution containing 100 μM ADPR or 300 μM ADPR, respectively. (D) Average Ca2+ signals measured in intact fura-2-AM-loaded INS-1 cells in response to 300 μM carbamylcholine (CCh) in the absence of extracellular Ca2+ and in the presence of 100 μM suramin and 1 μM CGS-15943 (control, black trace, n = 20) in the external solution. The red trace (n = 17) represents cells treated identically, but preincubated with 100 nM bafilomycin A for 30 min.
Fig. 5
Fig. 5
ADPR activates purinergic receptors and elicits Ca2+ influx, as well as Ca2+ release through TRPM2 in mouse pancreatic β cells. (A) Average TRPM2 currents in mouse pancreatic β cells isolated from C57BL/6 or TRPM2 KO mice. Cells were perfused with either 300 μM ADPR (green symbols, n= 7), 300 μM ADPR plus 1 mM AMP (blue symbols, n = 9) or 3 mM ADPR (black symbols, n = 6). TRPM2 KO cells were perfused with 1 mM ADPR (red symbols, n = 6). Current amplitudes were assessed as described in Fig. 2A. Error bars indicate SEM. (B) Typical current-voltage (I-V) relationship of currents evoked by 1 mM ADPR (black trace), 300 μM ADPR (green trace), or 300 μM ADPR + 1mM AMP (blue trace) taken from representative cells and recorded 100 s into the experiment. (C) Dose-response behavior of TRPM2 currents in mouse β cells as a function of internal ADPR concentration. Current amplitudes were measured at −80 mV, averaged, normalized to cell size, and plotted versus the respective ADPR concentration (n = 5 to 7). A dose-response fit to the data resulted in an EC50 value of 360 μM with a Hill coefficient of 1. (D) Average Ca2+ signals measured in intact fura-2-AM–loaded mouse β cells in response to increasing concentrations of extracellular ADPR and in the absence of extracellular Ca2+ [1 μM (red trace, n = 4), 10 μM (blue trace, n = 5), 30 μM (green trace, n = 6), 100 μM (black trace, n= 6)]. Start of application indicated by black arrow. (E) Average Ca2+ signals measured in intact fura-2-AM–loaded mouse β cells in response to application of 200 μM ADPR in the absence of extracellular Ca2+ and in the presence of either 100 μM suramin (red trace, n = 6) or 1 μM CGS-15943 (black trace, n = 8) in the external solution. (F) Balanced fura-2 experiments showing average Ca2+ signals in whole-cell patch-clamped C57BL/6 mouse pancreatic β cells (black trace, n = 7) or β cells isolated from TRPM2 KO mice (red trace, n = 10) preloaded with fura-2-AM. Whole-cell break-in indicated by red arrow. Cells were kept in 0 Ca2+ external solution and perfused with internal solution containing 300 μM ADPR and 200 μM fura-2. The gray traces show two representative responses measured in individual wild-type (WT) cells.
Fig. 6
Fig. 6
The ectoenzyme CD38 is key in cADPR-induced Ca2+ signals. (A) Average Ca2+ signals in intact wild-type HEK293 cells in response to extracellular application of 10 mM cADPR (red trace, n = 8) or 10 mM NAD+ (black trace, n = 6) in the absence of extracellular Ca2+. Application and fura-2-AM loading as described in Fig. 1A. (B) Average Ca2+ signals in intact fura-2-AM–loaded INS-1 cells in response to 30 μM external cADPR (red trace, n = 5) or 100 μM NAD+ (black trace, n = 10) in the absence of extracellular Ca2+. Application start is indicated by the arrow. (C) Average Ca2+ signals measured in intact fura-2-AM–loaded primary mouse β cells in response to external application of either 300 μM cADPR (red trace, n = 6) or 1 mM NAD+ (black trace, n = 8). (D) Average Ca2+ signals measured in intact fura-2-AM–loaded pancreatic β cells isolated from CD38 knockout mice (28) in response to external application of either 100 μM ADPR (black trace, n = 4), 100 μM ATP (blue trace, n = 8), or 300 μM cADPR (red trace, n = 20). (E) Average Ca2+ signals measured in intact fura-2-AM–loaded mouse pancreatic β cells. As indicated by the arrow, 100 μM ADPR was co-applied with either 30 μM NAD+ (black trace, n = 6) or 100 μM NAD+ (red trace, n = 6) in a 0 Ca2+ solution. (F) Average Ca2+ signals measured in wild-type HEK293 cells in response to application of extracellular ADPR (100 μM) in the presence of either 1 mM NAD+ (red trace, n = 9) or 300 μM NAD+ (black trace, n = 7) and in the absence of extracellular Ca2+. Application started as indicated by the arrow and was maintained throughout the experiment.
Fig. 7
Fig. 7
TRPM2-mediated Ca2+ release induces cell death under oxidative stress. (A) Average values for percent of PI-positive cells. INS-1 cells transfected with control (GAPDH) or TRPM2 siRNA were treated with 100 μM H2O2 for 10 min either in RPMI 1640 medium that contained 0.42 mM Ca2+ (black bars, n = 5) or was Ca2+-free (red bars, n = 11). PI-positive cells were analyzed by flow cytometry. Data points are mean ± SEM. Comparing H2O2-treated and -untreated control (GAPDH) cells, H2O2-treated control (GPDH) and TRPM2 siRNA cells, or untreated control (GAPDH) cells with H2O2-treated TRPM2 siRNA cells showed a statistical significance of P < 0.001 in each case, both in the presence and absence of extracellular Ca2+. (B) Representative PI profile of cells tested in the presence of extracellular Ca2+. (C) Representative PI profile of cells tested in the absence of extracellular Ca2+.

Similar articles

Cited by

References

    1. Perraud AL, Fleig A, Dunn CA, Bagley LA, Launay P, Schmitz C, Stokes AJ, Zhu Q, Bessman MJ, Penner R, Kinet JP, Scharenberg AM. ADP-ribose gating of the calcium-permeable LTRPC2 channel revealed by Nudix motif homology. Nature. 2001;411:595–599. - PubMed
    1. Sano Y, Inamura K, Miyake A, Mochizuki S, Yokoi H, Matsushime H, Furuichi K. Immunocyte Ca2+ influx system mediated by LTRPC2. Science. 2001;293:1327–1330. - PubMed
    1. Hara Y, Wakamori M, Ishii M, Maeno E, Nishida M, Yoshida T, Yamada H, Shimizu S, Mori E, Kudoh J, Shimizu N, Kurose H, Okada Y, Imoto K, Mori Y. LTRPC2 Ca2+-permeable channel activated by changes in redox status confers susceptibility to cell death. Mol Cell. 2002;9:163–173. - PubMed
    1. McHugh D, Flemming R, Xu SZ, Perraud AL, Beech DJ. Critical intracellular Ca2+ dependence of transient receptor potential melastatin 2 (TRPM2) cation channel activation. J Biol Chem. 2003;278:11002–11006. - PubMed
    1. Kolisek M, Beck A, Fleig A, Penner R. Cyclic ADP-ribose and hydrogen peroxide synergize with ADP-ribose in the activation of TRPM2 channels. Mol Cell. 2005;18:61–69. - PubMed

Publication types

MeSH terms